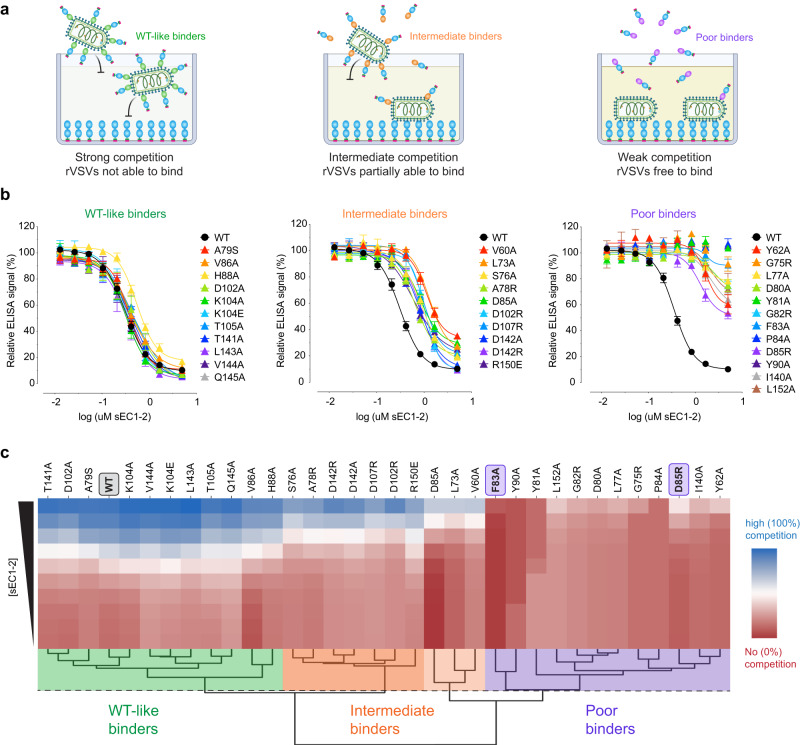
Fig. 4. Binding capacity of mutant sEC1-2 to ANDV Gn/Gc.
a Diagram of competition ELISA depicting three different competition outcomes of mutant sEC1-2 proteins’ capacity to block rVSV-ANDV-Gn/Gc binding to sEC1-2(WT) coated wells. b Competition ELISA using WT and mutant sEC1-2 as competitive reagents to the binding of rVSV-ANDV-Gn/Gc to sEC1-2(WT) coated wells. The ELISA signal was normalized to that obtained without competing sEC1-2. Averages ± SEM: n = 6 wells of each dilution examined over three independent experiments, except for: sEC1-2(D102A, K104A, K104E, T105A, V144A, Q145A, D102R, D142A, G75R, Y81A, P84A, I140A) have n = 8 wells examined over four independent experiments [sEC1-2(Y81) has n = 7 wells for one dilution]. sEC1-2(WT) was used as a reference control for each experiment performed and has n = 32 wells of each dilution examined over 16 independent experiments. c Hierarchical clustering of WT and mutant sEC1-2 generated from sigmoidal curves of the competition ELISA data in (a). The dendrogram shows four clusters, separating the poor binders from the WT-like binders. The dotted line denotes the height at which the dendrogram is cut representing varying degrees of binding strength; WT-like binders (green), intermediate binders (WT-like-to-intermediate binders in dark orange, intermediate-to-poor binders in light orange), and poor binders (purple). The red to blue colorbar ranges from 0 to 100 which is determined by the minimum and maximum values observed in the heatmap. (sEC1-2, soluble extracellular cadherin domains 1 and 2). Figure (a) was created with BioRender.com. Source data are provided as a Source Data file.

