Figure 3.
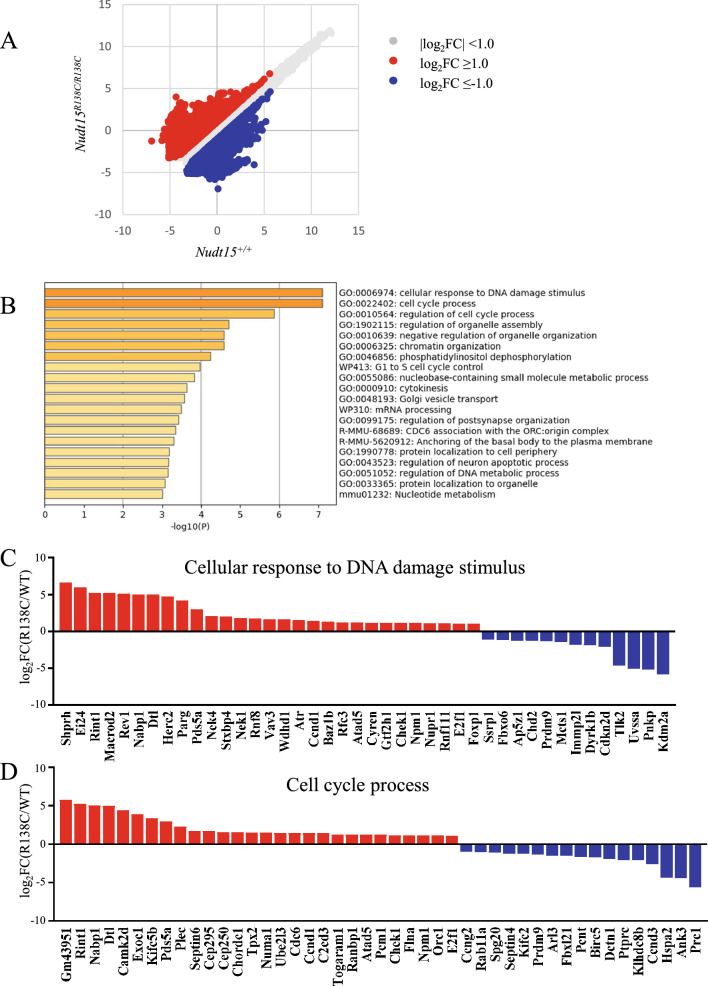
Gene expression profiling via RNA-seq and GO analyses. HSCs were sorted 24 h after peritoneal administration of 5 mg/kg 6-MP and were analyzed via RNA-seq. (A) Scatter plot comparing Nudt15+/+ HSC (WT, N = 3) and Nudt15R138C/R138C HSC (R138C, N = 3). (B) GO analysis. Differentially expressed genes (log2FC >|1|, p < 0.05) were analyzed using Metascape (http://metascape.org). The top 20 GO terms are presented. (C) Change in expression of genes listed under cellular response to DNA damage stimulus. (D) Change in expression of genes listed under the cell cycle process.

