
Fig. 10. Load damping impact on CNN prediction accuracy and voltage spectra.
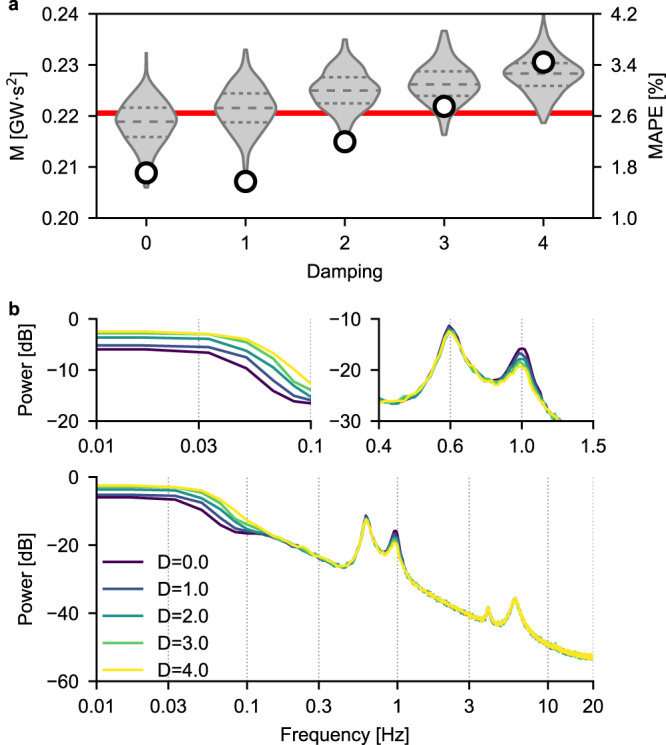
a Violin plots of the predicted values of momentum when the load damping of generators G2 and G3 is increased from 0 to 4. Each violin represents the distribution of N = 300 predicted momentum values, with the inner dashed lines indicating, from bottom to top, the 25th, 50th and 75th percentile, respectively. The red line represents the correct value of momentum, obtained with values of inertia of G2 and G3 equal to 4.33 s and 4.47 s, respectively. The circular markers are the values of MAPE, indicated on the right axis. b PSDs of for different values of load damping of G2 and G3. Insets show the PSD in those regions where the effect of varying generators load damping is more prominent.