
Fig. 7. Area momentum prediction upon step-wise inertia variations.
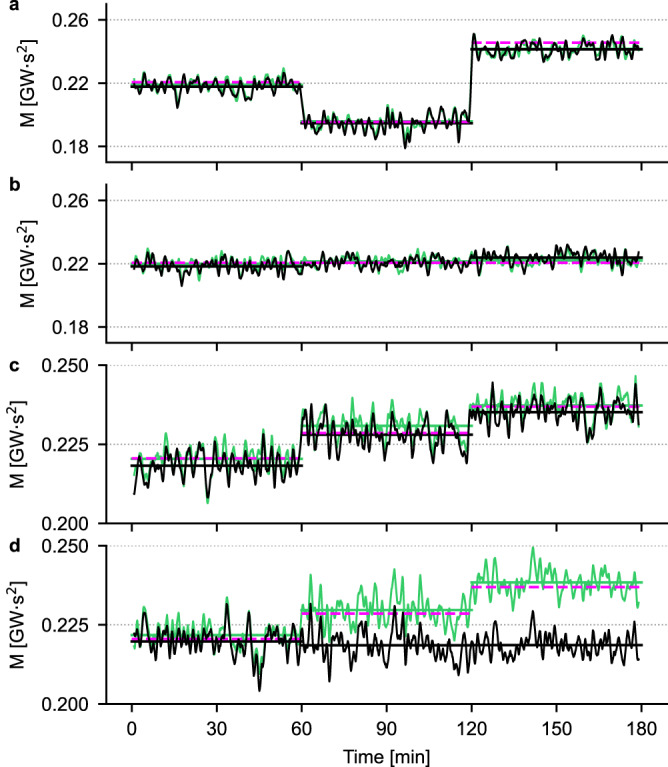
In all panels, the black trace is the value of momentum predicted by a CNN trained on a dataset where the compensator’s inertia was fixed at 0.1 s, while the green traces are the predictions of a CNN trained on an extended dataset in which, for each pair of inertia values shown in the grid in Fig. 2a, three values of compensator’s inertia were considered, namely 0.1 s, 2.5 s and 5 s. a Different values of momentum obtained by changing the inertia of G2 and G3. b Fixed value of momentum obtained for different combinations of the inertia of G2 and G3. c Different values of momentum obtained by progressively increasing the inertia of G2 and G3. d Same values of momentum as in c, obtained by increasing the inertia of the compensator in area 1.