
Fig. 8. Spectral analysis of the data used for training the CNN.
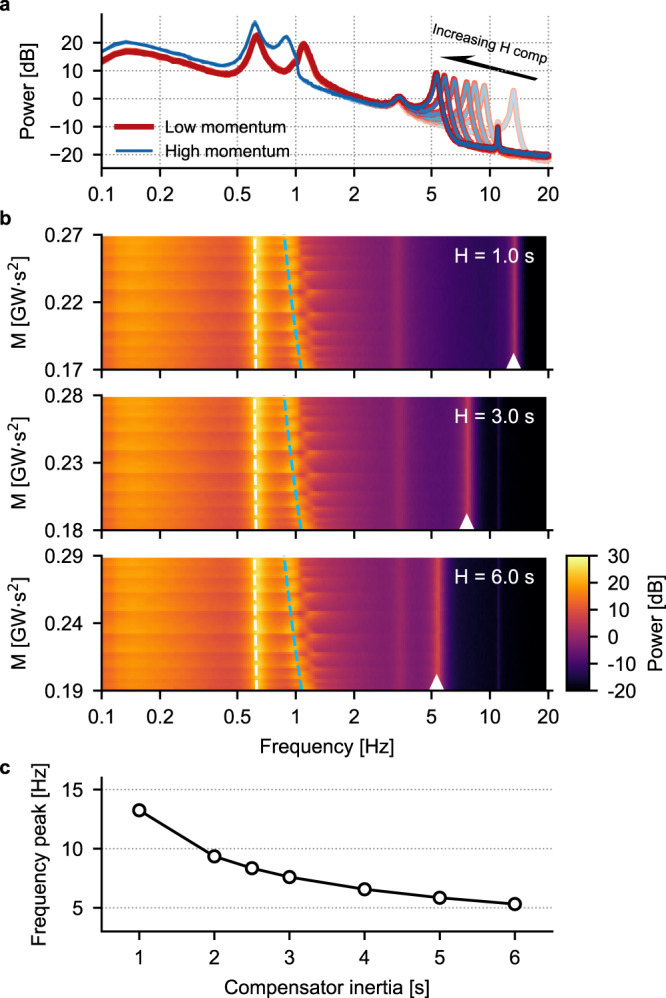
a Example PSDs for different momentum values: see the text for an explanation of the color code. b Spectrograms in the (0.1, 20) Hz frequency range for different values of momentum and for the three values of compensator’s inertia. The white and blue dashed lines indicate the position of the two low-frequency peaks of the PSDs and are fit of the actual positions with functions of the form y = axb, with a and b parameters fit to the data. White arrowheads are placed at the location of the high-frequency peak of the PSDs. c The location of the high-frequency peak displays a monotonous dependence on the compensator’s inertia.