
Fig. 9. Momentum prediction in the presence of a VSG.
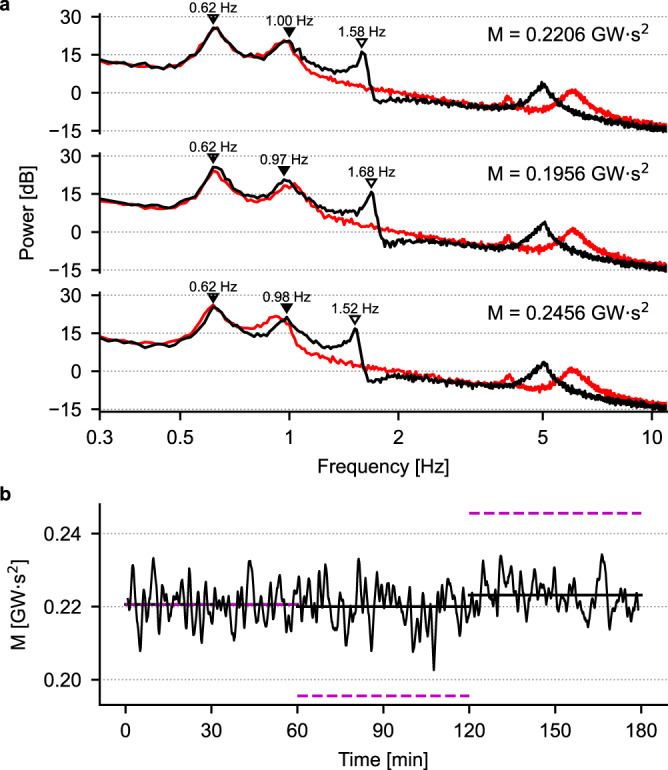
a Black traces, PSDs of the voltage at bus 3 of the IEEE 39-bus network when G3 is replaced by a VSG. Red traces, PSDs of the same signal in the default power network, i.e., with the synchronous generator G3 present. The momentum values indicated in each panel have been obtained by changing either the inertia of the generator G2 and of the VSG (black traces) or the inertia of the generators G2 and G3 (red traces). Empty (filled) arrowheads indicate the positions of PSD peaks in the black traces that (do not) change position when area momentum is varied. b Momentum prediction by the CNN: the black trace is the moving average of the predicted momentum, while the magenta dashed lines indicate the correct value of area momentum. The prediction is accurate only when the black and red traces in panel a overlap for frequencies up to ~1 Hz.