
Fig. 2. Best RECIST response and time on study in Module 1B-1.
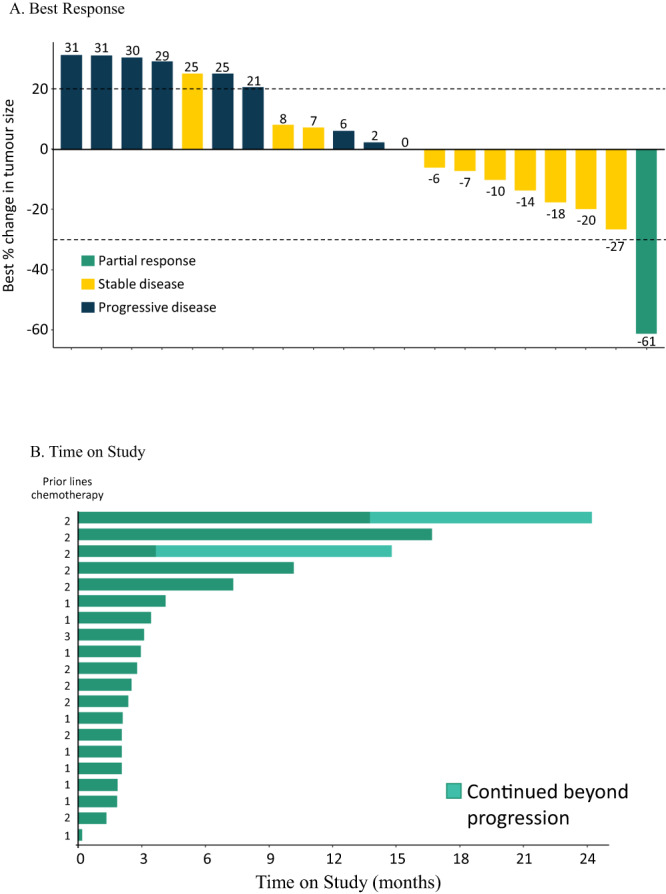
A Best response. Each bar represents the best percentage change from baseline for an individual patient. N = 19 (Note: only participants with at least one post-baseline value are included in this figure). * Lesion size increase from 12 to 15 mm was below the threshold for classification as progressive disease (minimum increase of 5 mm). B Time on study. Time on study for each patient (prior lines of chemotherapy for each patient indicated). N = 20.