
Fig. 3. Best RECIST response and time on study in Module 2A.
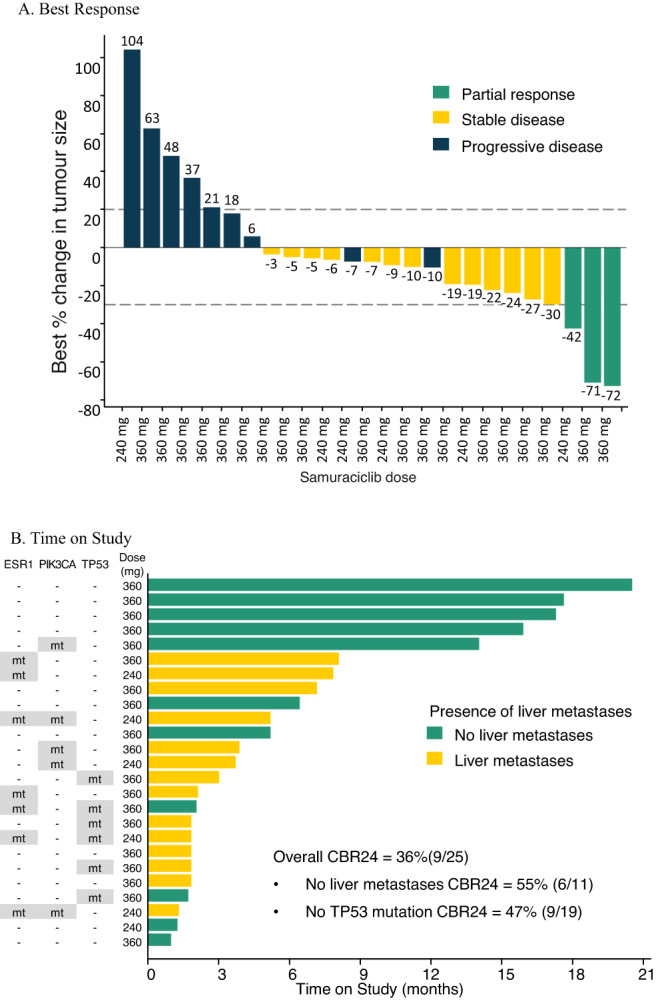
A Best response. Each bar represents the best percentage change from baseline for an individual patient. N = 25 (Note: only participants with at least one post-baseline value are included in this figure). B Time on study. Time on study for each patient (presence of liver metastases and mutation status for each patient also indicated). N = 25. CBR24 clinical benefit rate at 24 weeks, mt mutation detected.