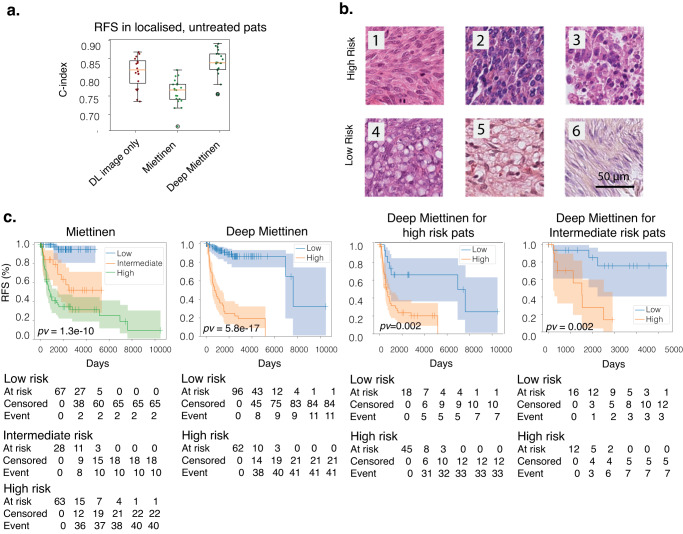
Fig. 2. DL predicts risk of relapse from HES slides.
a Concordance index of predicting incidents using HES slides alone (dark red), Miettinen risk criteria(light green) and Deep Miettinen(dark green) for RFS in localized, untreated patients. Shown is the distribution across 5 repetitions of 4-fold cross-validation (n = 20 for each boxplot). All boxplots demarcate quartiles and median values, while whiskers extend to 1.5× the interquartile range. b Example of tiles with high and low (indicated on the left) estimated risk based on the histopathological features. The most predictive tiles for high risk of relapse showed mitoses (1), high cellular density (2) and necrosis (3) while tiles with low risk of relapse showed cytoplasmic vacuolization (4, 5) low cellular density (6). c Kaplan–Meier plots shown for RFS for localized untreated patients within different categories. From left to right: risk groups defined by Miettinen; risk groups defined by Deep Miettinen (Low risk corresponds to risk score <mean + 0.2*std); risk groups defined by Deep Miettinen for high risk patients defined by Miettinen; risk groups defined by Deep Miettinen for intermediate risk patients defined by Miettinen.

