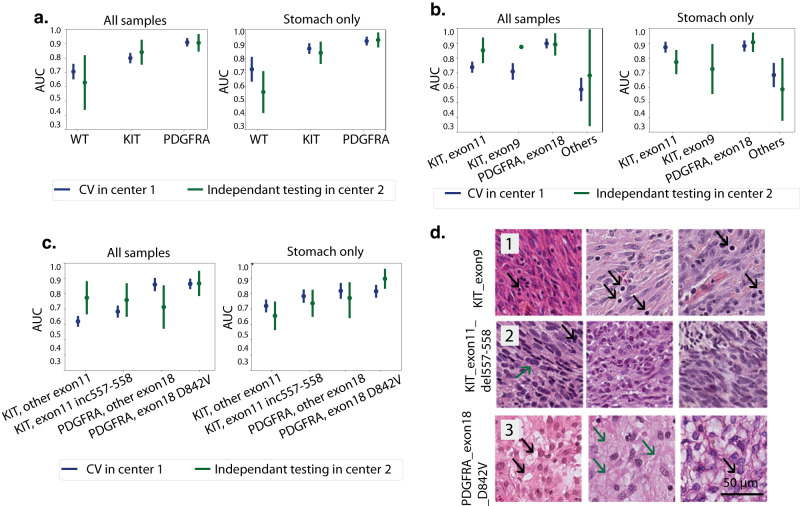
Fig. 3. DL predicts mutations from HES slides.
a Line plots with AUC values for mutation classification at gene level. Shown for all samples (left) and samples from stomach tumors only (right). Each point corresponds to the average AUC from 4-fold cross validation. AUCs from left-out fold during training are shown in blue and AUCs from independent testing are shown in green. Error line indicates the CI estimated using cvAUC. b Line plots with AUC values for mutation classification at exon level. c Line plots with AUC values for mutation classification at codon level. d Example of correctly predicted tiles for each mutation at codon level. 3 tiles per mutation are shown with the mutation type indicated on the top: the most predictive tiles for KIT exon9 mutation (1) showed lymphoid infiltrate (black arrows); the most predictive tiles for KIT exon11 del557_558 (2) showed mitoses (black arrow) and nuclear hyperchromasia (green arrow) and the most predictive tiles for PDGFRA exon18 D842V (3) showed vacuolization of cells (black arrows) and myxoid stroma (green arrows).

