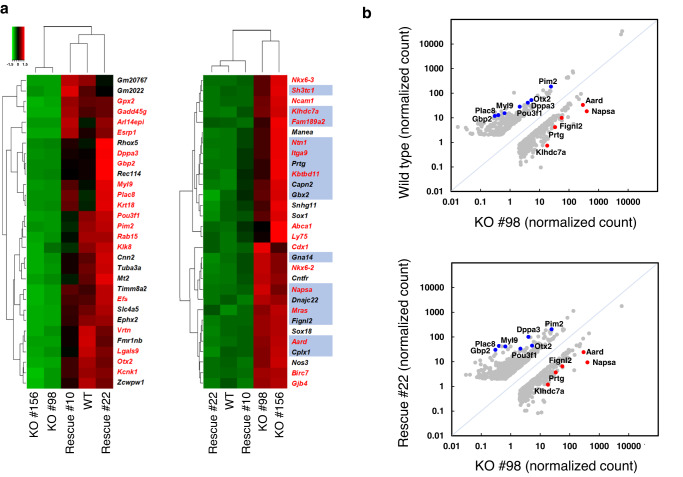
Fig. 2. Effects of Zfp296 deficiency and overexpression on the transcriptome of ESCs.
a Heatmap showing Z-score normalized transcript levels of the genes differentially expressed among WT, KO #98 and #156, and Rescue #22 and #10 ESCs. Red and green colors represent up- and down-regulation, respectively. The left and right panels show the top 30 genes most highly down- and up-regulated upon Zfp296 KO, respectively (KO vs. WT ESCs, P < 0.05). Genes with normalized read counts less than 8 in all the ESCs and noncoding genes were omitted. Dendrograms show hierarchical clustering analysis of the five ESC lines and the 30 genes in each panel. ZFP296 binding peaks from ChIP-seq were found in the vicinity of 16 genes (highlighted in blue) out of the 30 genes upregulated upon Zfp296 KO. Genes highly induced and strongly repressed in EpiLCs22 are shown in red in the left and right panels, respectively. b Scatterplots of RNA-seq TMM normalized read counts of the genes that showed more than 3-fold (WT > KO #98 ESCs) or 2.5-fold (WT < KO #98 ESCs) difference (upper panel) and those that showed more than 3-fold difference (Rescue #22 vs. KO #98 ESCs; lower panel). Genes with normalized read counts less than 2 in all the ESCs were omitted. Blue and red dots represent some of the genes markedly down- and up-regulated in KO ESCs, respectively.

