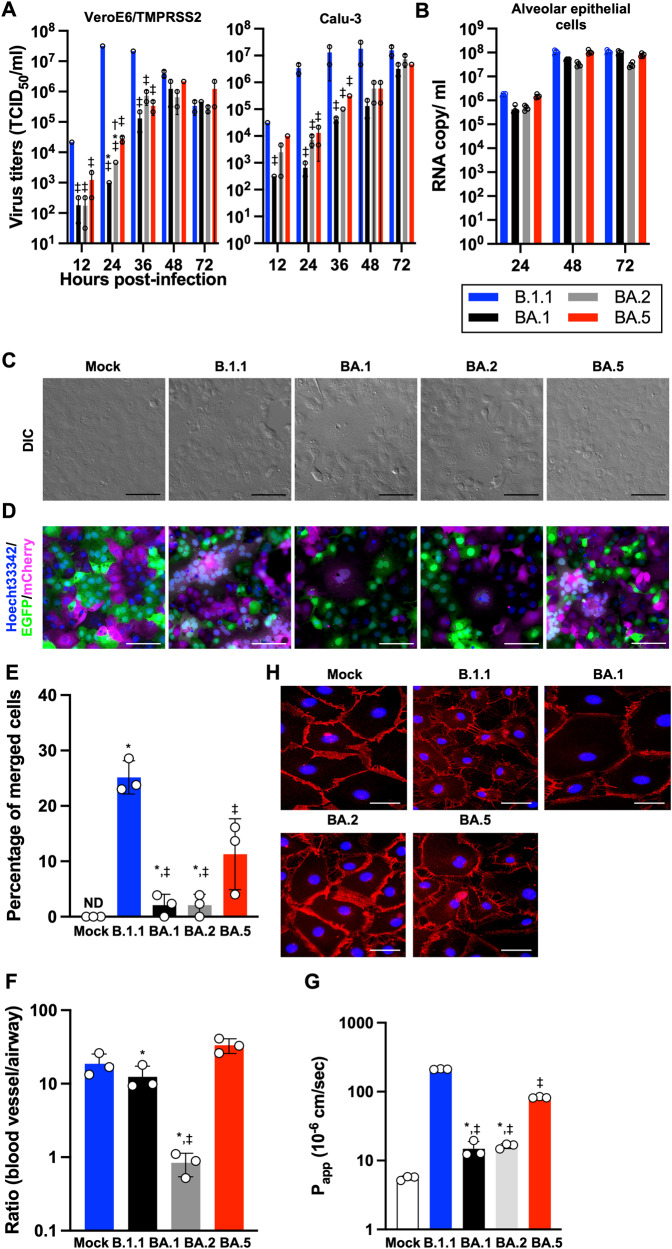
Fig. 1. Virological features of Omicron subvariants in vitro.
A, B Growth kinetics of Omicron subvariants. The four clinical isolates of B.1.1, Omicron BA.1, BA.2, and BA.5 were inoculated into VeroE6/TMPRSS2, Calu-3 (A), and human alveolar epithelial (B) cells, the infectious titers in the supernatant from VeroE6/TMPRSS2 and Calu-3 cells were determined by a TCID50 assay and the copy number of the viral RNA in the supernatant from human alveolar epithelial cells was quantified by RT-qPCR. C Bright-field images of infected VeroE6/TMPRSS2 cells (m.o.i. = 0.01) at 32 h.p.i. D SARS-CoV-2 induced syncytial formation. EGFP- and mCherry-expressing VeroE6/TMPRSS2 cells were co-cultured at a 1:1 ratio and infected with B.1.1, BA.1, BA.2, and BA.5 isolates. Scale bars, 200 μm. Syncytial formation was monitored by immunofluorescent microscopy at 32 h.p.i. Nuclei were counter-staining with Hoechst 33342. Scale bars, 100 μm. The representative images are shown. E The percentage of nuclei in the syncytia was calculated and shown as a bar graph. ND: not detected. F Airway-on-a-chip analysis. Medium containing SARS-CoV-2 was injected into the airway channel, which was then cultured for 6 days. Viral RNA in the supernatant of both airway and blood vessel channels was quantified by RT-qPCR. The ratio of viral invasion toward blood vessel channels was calculated (blood vessel channel/airway channel) on 6 d.p.i., as shown by percentages. G FD4 permeability assay of uninfected and infected airway-on-a-chip at 6 d.p.i. Papp, apparent permeability coefficient. H Immunofluorescent staining for VE-cadherin (red) in HMVEC-L in the uninfected and infected airway-on-a-chip. Nuclei were counterstained with DAPI (blue). Scale bars, 10 μm. Assays were performed independently in duplicate (A) or triplicate (B, E, F, G). In G, statistically significant differences between B1.1 and other variants (‡P < 0.05), between BA.5 and other variants (*P < 0.05), and between BA.1 and other variants (†P < 0.05) were determined by Tukey’s multiplicity correction. In E, the statistical significance of differences between B1.1 and other variants (‡P < 0.05), and between BA.5 and other variants (*P < 0.05) were determined by Tukey’s multiplicity correction. In F, using Tukey’s multiplicity correction test, the ratio (blood vessel channel/airway channel) of BA.5 was significantly higher than that of BA.1 and BA.2. Both the ratio of B.1.1 and BA.1 was also significantly higher than that of BA.2. In G, statistically significant differences between B1.1 and other variants (‡P < 0.05), and between BA.5 and other variants (*P < 0.05) were determined by Tukey’s multiplicity correction.

