
Figure 3.
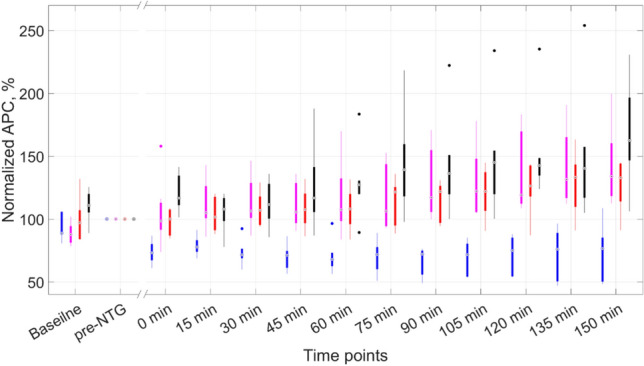
Dynamics of the APC index normalized to its value assessed at the pre-NTG time point in reaction to intraperitoneal administration of nitroglycerin. The time point designations on the X-axis are the same as in Fig. 2. Blue boxes correspond to rats of the control subgroup with the negative NTG-response, magenta boxes are for rats of the positive NTG subgroup, red boxes are for rats of the sumatriptan-pretreated subgroup at a dose of 4 mg/kg, and black boxes are for sumatriptan-pretreated rats at 10 mg/kg. Significance of the differences is not shown, see the text to its assessment.