
Figure 1.
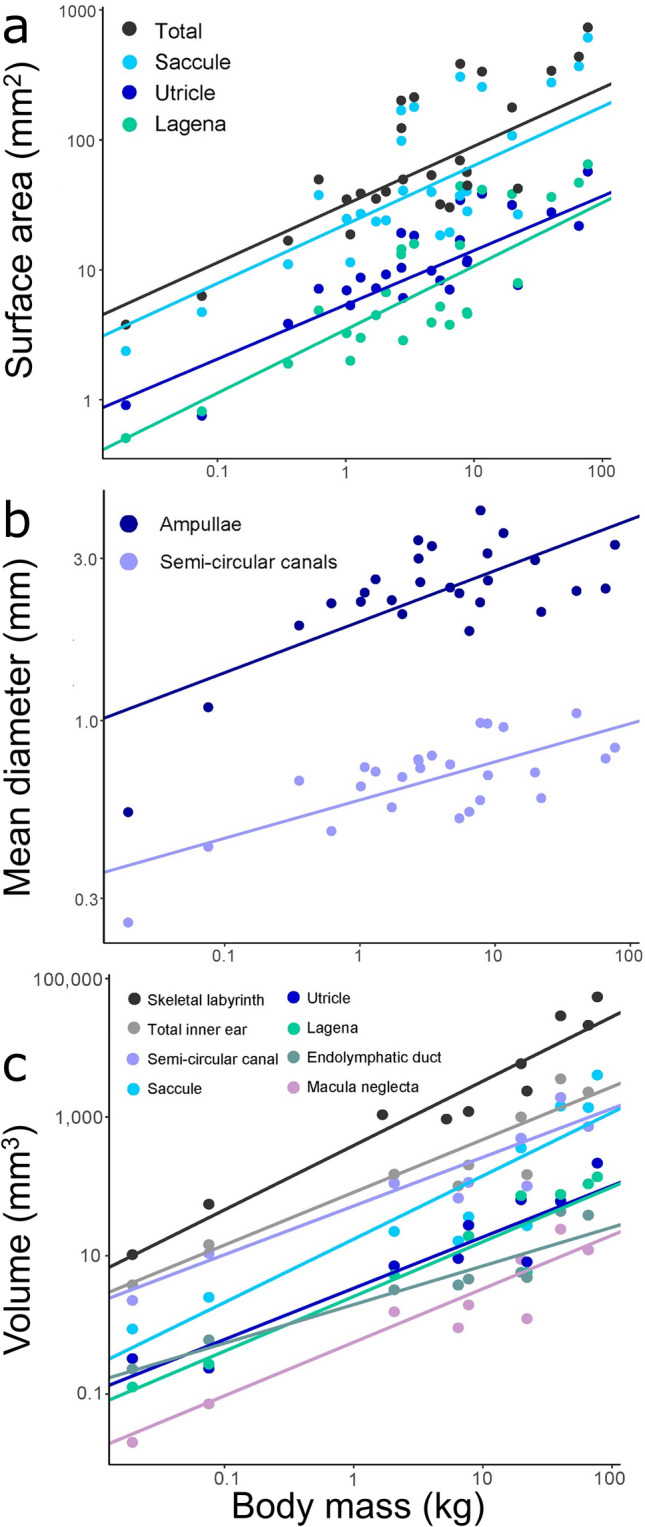
Interspecific scaling relationships of body size and inner ear measurements. Scaling relationships (logarithmic axes) from pGLS models between (a) body mass and surface area of the saccule, lagena, and utricle (and their combined total surface area) across 26 elasmobranch species. Total surface area = 0.45x + 0.16. Saccule = 0.45x – 0.01. Lagena = 0.49x – 0.93. Utricle = 0.42x – 0.52; (b) body mass and mean diameter of the semi-circular canals and ampullae from 26 elasmobranch species. Mean ampulla diameter = 0.15x – 0.16. Mean semi-circular canal diameter = 0.11x – 0.57; (c) and body mass and volume of different inner ear structures in 10 species. Saccule = 0.91x – 1.50. Lagena = 0.79x – 1.95. Utricle = 0.74x – 1.69. Macula neglecta = 0.77x – 2.57. Endolymphatic duct = 0.56x – 1.38. Horizontal canals = 0.70x – 0.39. Soft labyrinth = 0.76x – 0.37. Skeletal labyrinth = 0.93x – 0.20. For full regression outputs, see Tables S1 and S2.