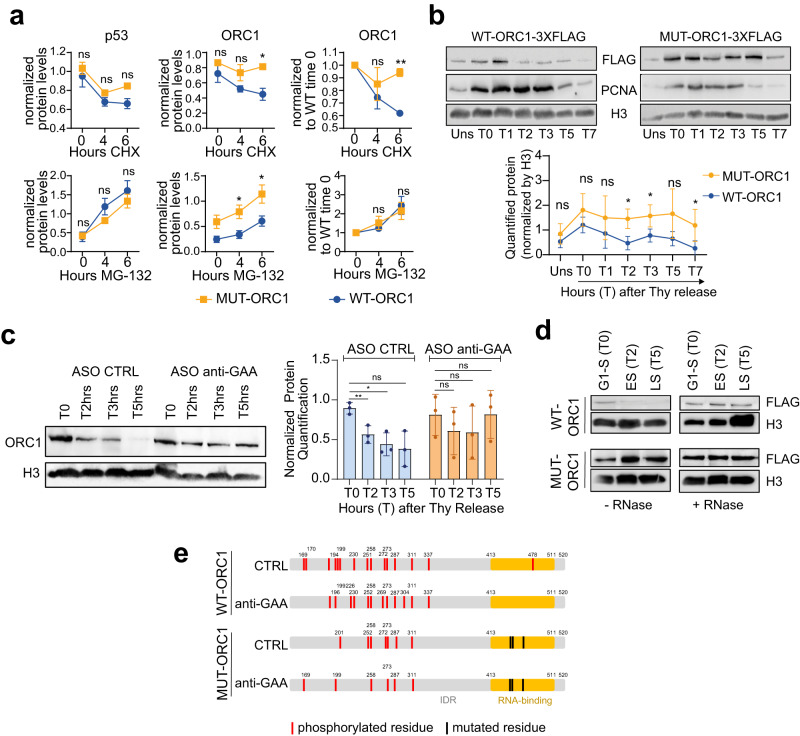
Fig. 4. RNA regulates ORC1 chromatin release.
a p53 and ORC1-3xFlag protein quantification from western blots with total extracts of HCT116 cells, transfected with WT or MUT-ORC1, and treated with cycloheximide (CHX) or MG-132. Dots represent mean values (n = 3 biologically independent experiments) ± SEM. ns denotes p value >0.05, * denotes p value <0.05, ** denotes p value <0.01, derived from paired two-tailed Student’s t-test. b Western blot on chromatin extracts of HCT116 cells, transfected with Flag-tagged WT-ORC1 and MUT-ORC1, unsynchronized (Uns) or synchronized in G1/S and released at different times (T as in Supplementary Fig. 8c). Below, normalized protein quantification. Dots represent mean values (n = 4 biologically independent experiments) ± SEM. ns denotes p value >0.05, * denotes p value <0.05, derived from paired two-tailed Student’s t-test. c Western blot and quantification of endogenous ORC1 on chromatin in different stages of the cell cycle (T as in Supplementary Fig. 8c), upon depletion of GAA-RNAs (ASO anti-GAA) or control conditions (ASO CTRL). Bars represent mean values (n = 3 biologically independent experiments) ± SEM. ns denotes p value >0.05, * denotes p value <0.05, ** denotes p value <0.01, derived from paired two-tailed Student’s t-test. d Western blot showing the effect of RNase A treatment on WT and MUT-ORC1 chromatin association, along the cell cycle of synchronized cells (T as in Supplementary Fig. 8c). Quantification of independent biological replicates (n = 4) is shown in Supplementary Fig. 8d. e Representation of the IDR in WT and MUT-ORC1, showing RNA-binding regions (orange), and the discrete positions of RNA-binding mutations (black) and phosphorylated residues (red) detected by mass spectrometry, in control or GAA-knockdown conditions. Source data are provided as a Source Data file.

