
Figure 3.
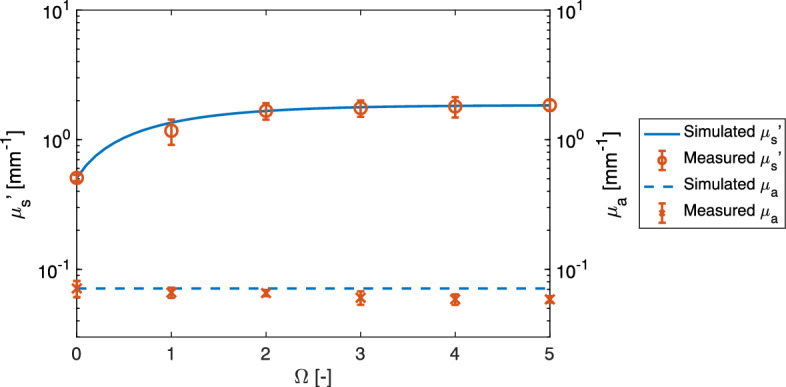
Comparison between simulated and measured reduced scattering and absorption coefficients at a wavelength of 980 nm for different damage parameter values. The error bars represent the standard deviation.
Official websites use .gov
A
.gov website belongs to an official
government organization in the United States.
Secure .gov websites use HTTPS
A lock (
) or https:// means you've safely
connected to the .gov website. Share sensitive
information only on official, secure websites.
Comparison between simulated and measured reduced scattering and absorption coefficients at a wavelength of 980 nm for different damage parameter values. The error bars represent the standard deviation.