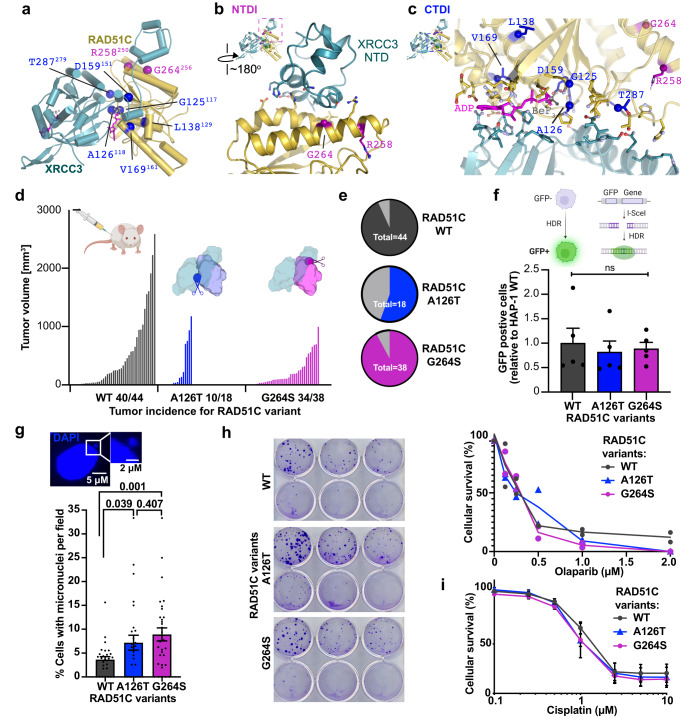
Fig. 2. RAD51C cancer mutations spotlight two RAD51C-XRCC3 interface regions.
a Mapping of recurrent RAD51C cancer mutations onto the apCX3 structure. Mutations clustered at the RAD51C-XRCC3 NTD interface with RAD51C (NTDI) are colored purple and mutations mapping around the CX3 ATP and CTD interface (CTDI) are colored blue. Residue numbering denotes human RAD51C with corresponding A. pompejana numbering in superscript. b Close up view to show residues within 4.5 Å of the RAD51C-XRCC3 NTDI. c Close up view of the extended CX3 CTDI. Residues within 4.5 Å of the interface are shown. d Tumor volume for xenografts of HAP1 cells expressing wild-type (WT) or RAD51C variants as indicated. Labeling on the x-axis denotes the number of tumors that grew compared to the number of independent injections. Schematics created with http://BioRender.com. e Pie chart representation of tumor take rate. f Dr-GFP HDR proficiency assays of HAP1 cells expressing wild-type (WT) or variant RAD51C as indicated. Top, schematic created with http://BioRender.com of Dr-GFP assay with I-Sce1 endonuclease induced double-strand break to measure homology directed repair (HDR) efficiency by the restoration of a functional green fluorescence protein (GFP). Data are presented as the mean +/− SEM. P values were calculated using an unpaired, two-sided Student T-test, n = 5 independent biological experiments. g Wild-type or RAD51C variant expressing HAP1 cells were assessed for presence of micronuclei expressed as percentage of cells with micronuclei per image field. Data are presented as the mean +/− SEM. P values were calculated using an unpaired, two-sided Student T-test, n = 5 independent biological experiments resulting in a total of n(WT) = 1351, n(A126T) = 1003, and n(G264S) = 1090. h Clonogenic survival assay with Olaparib. Left, images of plates exposed to varying concentrations of Olaparib increasing in from 0 at the top left to 2 µM at the bottom right. Right, Quantification whereby error bars represent the standard error of the mean, n = 2 independent biological experiments. i MTS survival assay with cisplatin. N = 5 independent biological experiments performed in triplicates, error bars represent the standard error of the mean.

