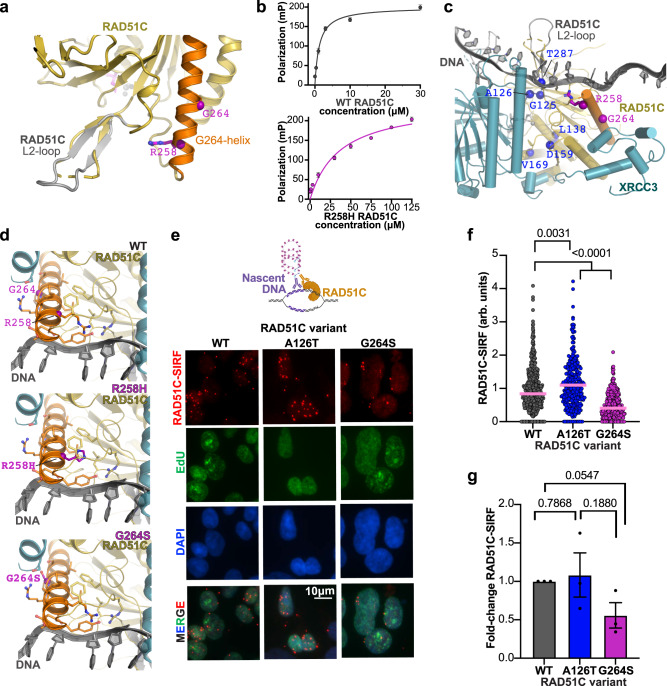
Fig. 4. CX3 NTDI mediates RAD51C DNA binding.
a Mapping of the R258H location onto apRAD51C-CTD shows positioning toward a disordered loop that corresponds to the DNA-binding RAD51 L2-loop. The α-helix (orange) containing R258 and G264 (purple) with a model of the RAD51C L2-loop, which closely matches the RAD51 L2-loop seen in DNA bound complexes, is overlaid in gray. b Fluorescence polarization assays measuring apRAD51C wild-type (top) and R258H (bottom) binding to single-stranded DNA (ssDNA). For each concentration mean polarization values from n = 3 technical replicates and standard deviation error bars are shown. c A model of ssDNA (gray) binding to the CX3 complex based on superposition of RAD51-ssDNA structures on the CX3 dimer. RAD51C variants are mapped as for Fig. 2. d Zoomed view of the structural environment of CX3 with RAD51C wild-type (WT) with R258 and G264 (top) plus models of the RAD51C R258H (middle) and G264S (bottom) mutations in relation to the modeled ssDNA path. The helix containing R258 and G264 is colored orange with residues within 4.5 Å shown (sticks). e Representative images of RAD51C-SIRF assay with 200 µM hydroxyurea in human HAP1 cells containing indicated variant RAD51C, which produces a red fluorescent signal if RAD51C and EdU labeled biotinylated nascent DNA are in close proximity (<40 nm). Cells were co-clicked with Alexa-Fluor 488 azide and biotin azide to enable simultaneous visualization of newly synthesized DNA (EdU, green) and SIRF signals (RAD51C-SIRF, red), DAPI denotes nucleus. SIRF signals are normalized to total EdU-azide 488 signal to account for potential difference in the amount of nascent DNA available to SIRF signal production (arbitrary unit, a.u.). Top, graphical schematic of a RAD51C-SIRF reaction created with http://BioRender.com. f Quantification of RAD51C SIRF signals from (e), pink bar denotes median. n(WT) = 360, n(126T) = 341, n(G264S) = 415, P values (<0.0001 between G264S and other variants, 0.0031 between WT and A126T) were calculated between each comparison using the two-sided Mann–Whitney test. g Fold-change of average RAD51C-SIRF signals in HAP1 cells with indicated RAD51C variants. Data are presented as the mean +/− SEM. P values were calculated using an unpaired Student two-sided T-test, n = 3 independent biological experiments.

