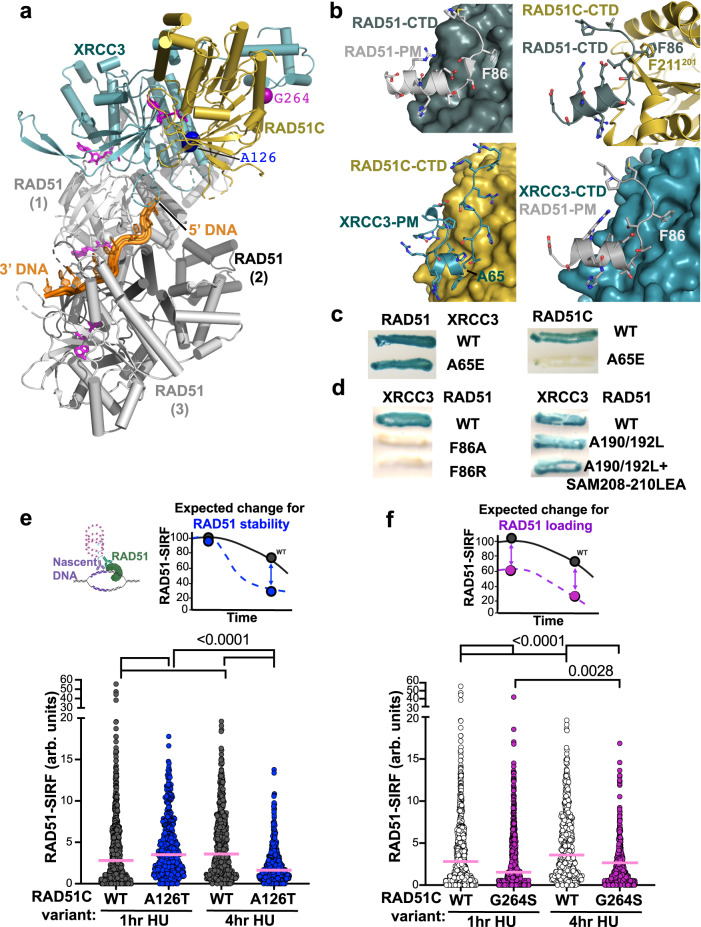
Fig. 5. CX3 mediates RAD51 filament loading and stability from structural and cellular analyses.
a Structural model showing how CX3 capping at the 5’-end of RAD51 filaments based on superposition of RAD51-ssDNA filament structures (PDB: 7EJC) with our CX3 structure. b Comparison of the canonical RAD51-RAD51 interaction mediated by the F86 polymerization motif (PM) (top left) to the XRCC3 PM interaction with RAD51C (bottom left) and predicted interactions of the RAD51 PMf with RAD51C (top right) and XRCC3 (bottom right) CTDs. c Yeast two-hybrid assay testing interactions between wild-type (WT) RAD51 and RAD51C with XRCC3 WT and PM A65E. d Yeast two-hybrid assay testing interactions between WT XRCC3 with WT RAD51 and indicated PM F86 (left) and CTD pocket (right) mutations. e Quantification of RAD51-SIRF signals in wild-type (WT) and RAD51C A126T HAP1 cells 1 h and 4 h after replication stalling with hydroxyurea, pink bar denotes median. Top left, graphical schematic of a RAD51-SIRF reaction created with http://BioRender.com, top right, expected outcome for RAD51 filament stabilization defects (blue). n(WT, 1 h) = 342, n(A126T, 1 h) = 463, n(WT, 4 h) = 347, n(A126T, 4 h) = 417, from 3 independent biological experiments. f Quantification of RAD51-SIRF signals in RAD51C G264S HAP1 cells 1 h and 4 h after replication stalling with hydroxyurea, pink bar denotes median. Data from wild-type (WT) HAP1 cells is replotted from (e), top right, expected outcome for RAD51 filament loading defects (purple). n(G264S, 1 h) = 701, n(G264S, 4 h) = 723, from 4 independent biological experiments. P values for all RAD51 SIRFs (<0.0001 for all comparisons except 0.0028 for G264S comparison at 1 h and 4 h post HU) were calculated between each comparison using the two-sided Mann–Whitney test.

