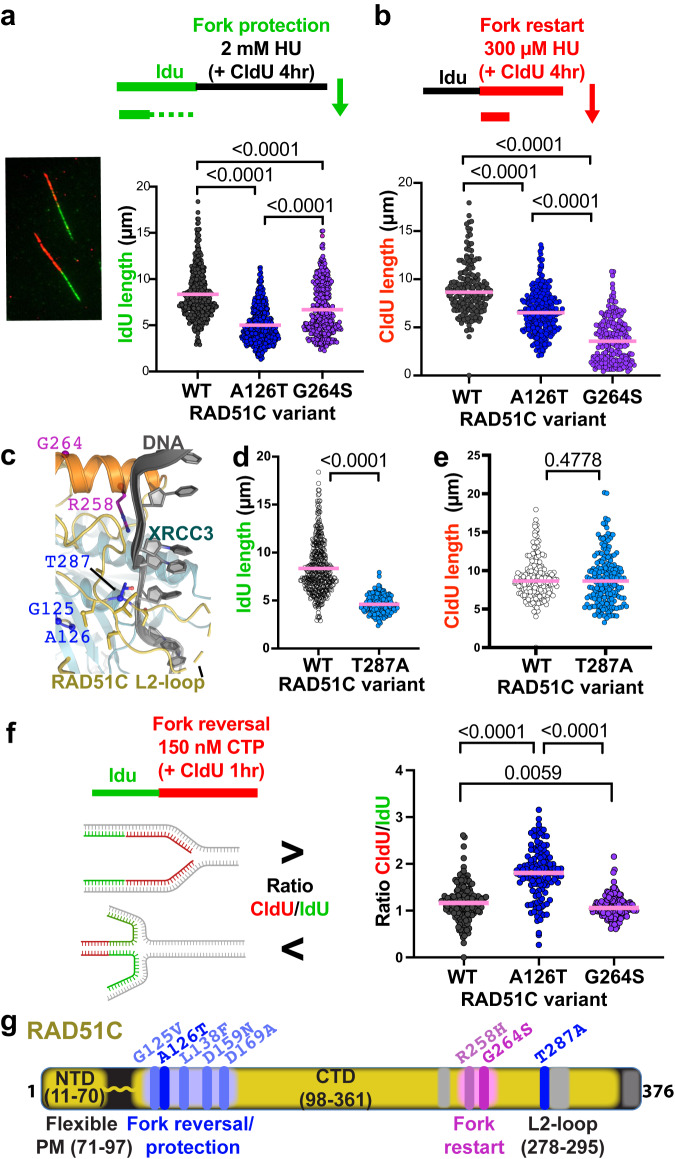
Fig. 6. Distinct replication stress reactions by CX3 CTDI and NTDI.
a Dot-blots of nascent IdU replication tracts lengths in human HAP1 cells containing indicated variant RAD51C. left, Representative image of single-molecule DNA fiber tracts labeled with IdU (green) and CldU (red). top, schematic of DNA fiber labeling with IdU, followed by CldU with high concentrations of hydroxyurea (HU) to measure fork protection. n = 4 independent biological experiments. n(WT) = 411, n(A126T) = 455, n(G264S) = 379, derived from 4 independent biological experiments. b Dot-blots of nascent CdU replication tracts lengths in human HAP1 cells containing indicated variant RAD51C. top, schematic of DNA fiber labeling with IdU, followed by CldU with low concentrations of hydroxyurea (HU) to measure replication fork restart. n(WT) = 185, n(A126T) = 275, n(G264S) = 211, derived from 3 independent biological experiments. c Zoomed view, using the CX3-DNA model from Fig. 4c, of the structural environment of RAD51C T287A with DNA, P-loop variants, G264-helix variants and residues within 4.5 Å of T287 (sticks) highlighted. d Dot-blots of nascent IdU replication tracts lengths followed by CldU with 2 mM of HU as in panel (a), in human HAP1 RAD51C T287A cells, results for wild-type HAP1 are replotted. n(T287A) = 170, derived from 2 independent biological experiments. e Dot-blots of nascent CldU replication tracts lengths in the presence of 300 µM HU as in panel (b), in human HAP1 RAD51C T287A cells, results for wild-type HAP1 are replotted. n(T287A) = 188, derived from 2 independent biological experiments. f Dot-blots of ratio of nascent CdU divided by IdU replication tracts lengths in human HAP1 cells containing indicated variant RAD51C. top, schematic created with http://BioRender.com of DNA fiber labeling with IdU, followed by CldU with low concentrations of camptothecin (CPT) to measure replication fork slowing during CPT indicative of replication fork reversal. n(WT) = 162, n(A126T) = 124, n(G264S) = 142, derived from 2 independent biological experiments. P values (shown above brackets in the figure panels) for all DNA fiber analysis and between each comparison were calculated using the two-sided Mann–Whitney test. g Schematic figure of RAD51C protein highlighting regions responsible for fork protection in blue and fork restart in pink.

