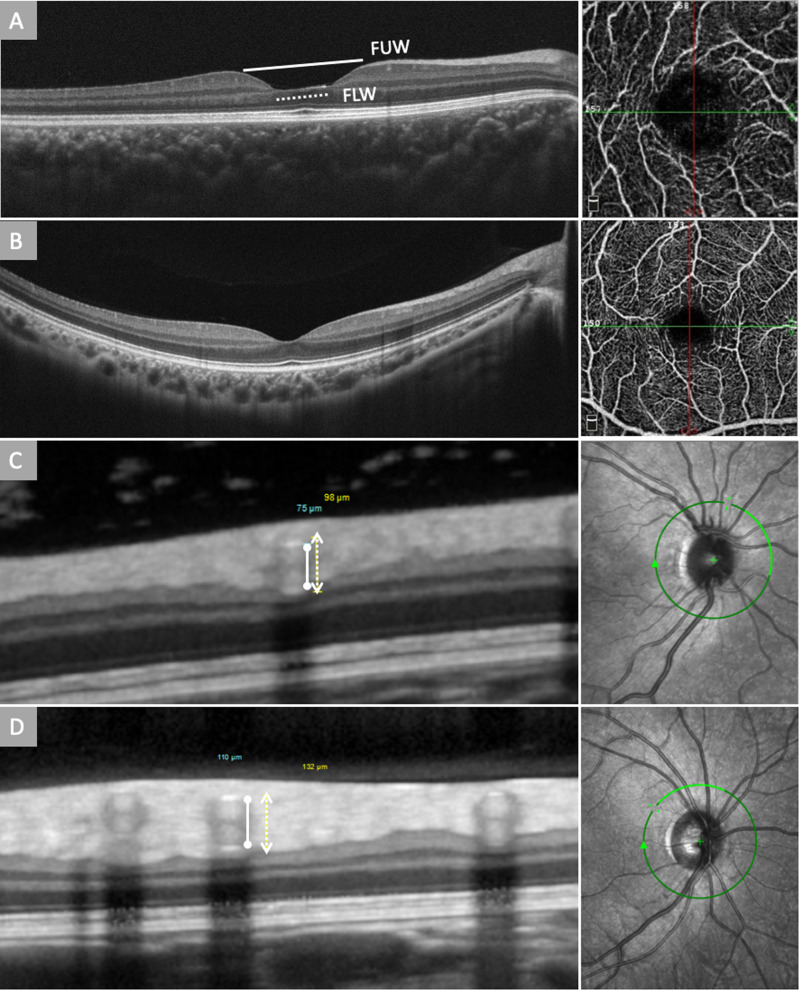
Fig. 2. Optical coherence tomography (OCT) and OCT angiography of Williams syndrome (WS) and healthy control.
A A macular OCT scan of a WS patient showing deepening and widening of the fovea. Foveal upper width (FUW, solid line) was measured as the horizontal distance between foveal crests on the nasal and temporal side, and fovea lower width (FLW, dotted line) was measured as the horizontal distance between the lowest point of the temporal and nasal slope; A macular OCTA of a WS patient showing reduced vascular density of the fovea and enlarged foveal avascular zone (FAZ). B Macular OCT and OCTA scan of a healthy subject showing normal foveal contour and vascular density of the fovea. C The green circle indicates the position of corresponding SD-OCT scan. Retinal vessel caliber measurements used in our study were based on 4 major arteries and veins arising from the edge of the optic disc. Sections of major retinal vessels appearing as a group of heterogeneous reflectivities in a hourglass configuration. The top and bottom of the vessel walls correlate to the innermost and outermost hyper-reflectivities. The solid line marks the inner reflections of the arterial vessel wall, and the dotted line marks the outer reflections of the arterial vessel wall of a William syndrome patient and (D) a healthy control. The arterial walls generally have higher reflectivity compared to the venous walls.

