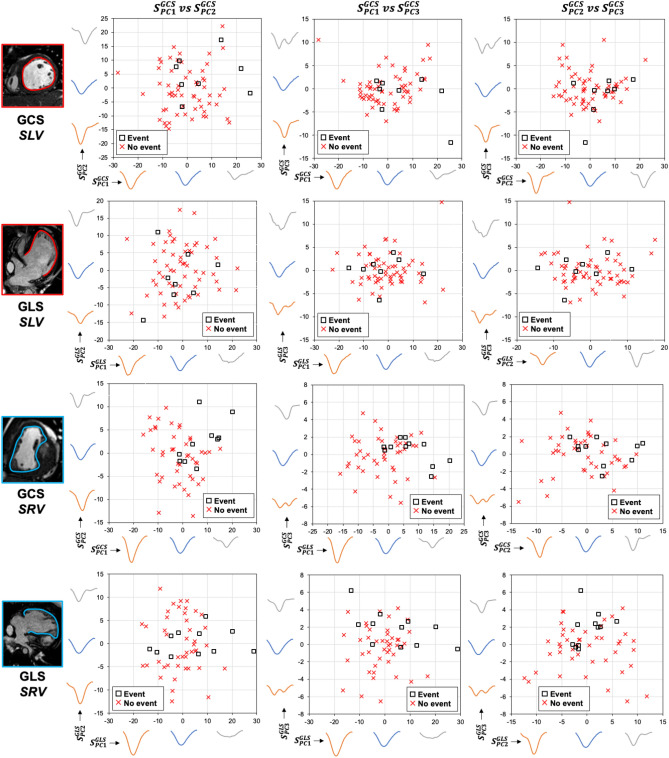
Figure 4.
The combination of the first three PCs strain scores plotted against each other for specific and single ventricle morphology and type of strain. X- and Y- axes further display how are calculated strain–time curve scores reflective of shape deformation. SLV single left ventricle, SRV single right ventricle, GCS global circumferential strain, GLS global longitudinal strain, PC principal component, S = principal component specific score individual to each patient.

