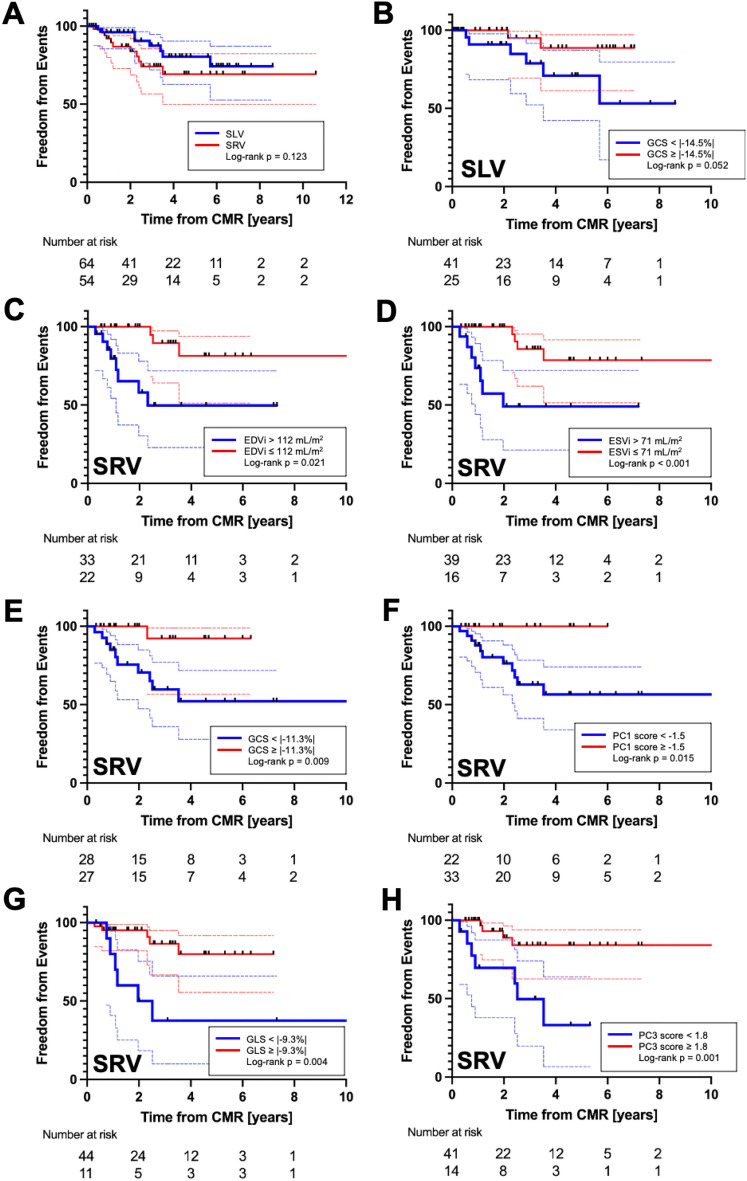
Figure 6.
Kaplan–Meier plots for SLV versus SRV comparison (A) and variables found to be predictive of clinical events on single variable Cox proportional hazard analysis. (B) GCS measured in the SLV group with cutoff value 14.5% approached statistical significance. In the SRV group, (C) EDVi > 112 mL/m2 and (D) ESVi > 71 mL/m2 had worse freedom from clinical events. (E) GCS in the SRV patients with value worse than − 11.3% and its related first PC score < − 1.5 (F) had overall worse freedom from events. GLS measured in SRV patients worse than − 9.3% (G) and its related third PC score < 1.8 (H) were also associated with cumulatively worse outcomes.

