
Figure 7.
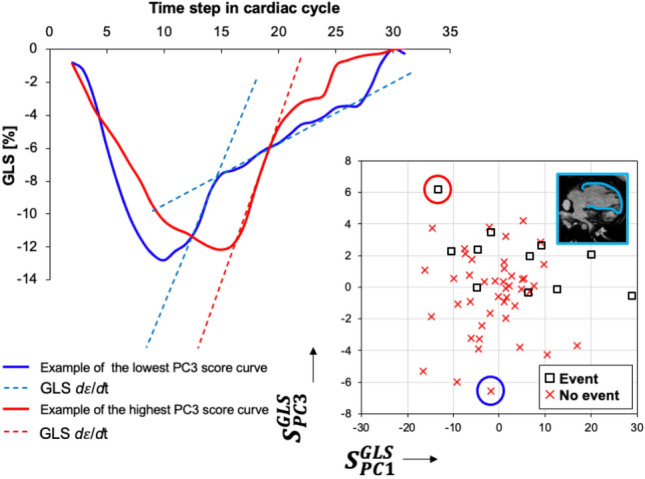
Graphical demonstration of the third principal component describing the post-systolic d/dt pattern derived from GLS curves in patients with SRV morphology. Strain–time curves of the two most representative patients with the most extreme opposite score values are depicted. Blue strain–time curve depicts a patient without clinical event demonstrating two distinct post-systolic relaxation slopes in early and late diastole, respectively (blue-dashed lines). This is analogous to a double peak diastolic strain rate pattern conventionally described as early and late diastolic strain rates. On the opposite end of the spectrum is a patient with a clinical event and corresponding strain–time curve (red) with primarily a single d/dt slope throughout the majority of diastole (single dashed red line). This would translate to a single peak diastolic strain rate.