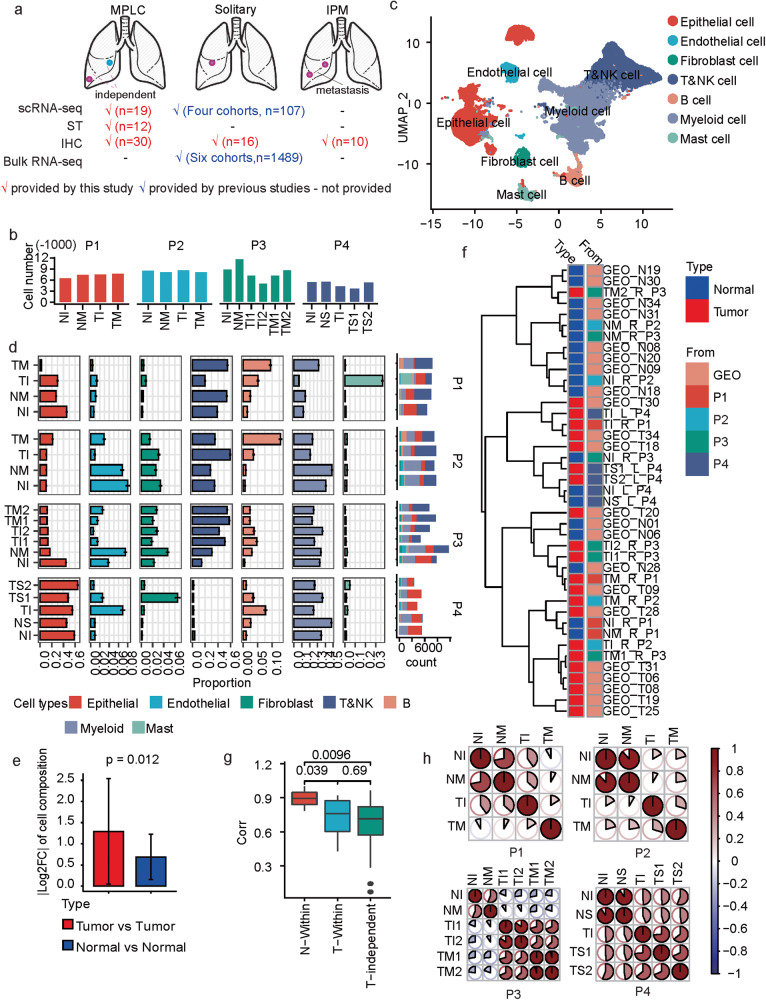
Fig. 1. scRNA-seq based tumor heterogeneity overview of MPLCs.
a Overview about the integrative data resources. b Number of cells in each sample after quality control. c Uniform Manifold Approximation and Projection (UMAP) of the 133923 cells based on scRNA-seq data. The cell types were annotated based on canonical cell type markers. d The proportions of different cell types within each measured sample. The y-axis represents the samples, and x-axis represents the percentage or total count. The proportions were estimated based on a bootstrap method, and represented in the form of mean ± s.d. The colors represent cell types. e The change of the cell type proportion between samples from different tumor lesions (red) or tumor-adjacent tissues (blue) within the same MPLCs patient. |·| means absolute value. Data represent mean ± s.d. t test, unpaired, one-sided. f Clustering both the samples collected by this study and the other LUAD tumor and adjacent normal tissue samples from an independent study (GEO dataset ID: GSE131907, n = 11 for both tumor and normal samples) based on the Spearman correlations between the cell type composition of two samples. See also Supplementary Fig. 2 for the clustering details. The sample names from GEO131907 begin with GEO, while the MPLC sample names begin with T or N. The letters L and R in the MPLC sample names represent left and right lung. g Boxplot of the correlations between different types of samples. t test, paired and one sided for comparing T-Within and N-Within, unpaired and two sided for the other comparisons. h The similarities between different samples within the same MPLCs patient. The similarity is based on the Spearman correlation coefficients between the average expressions of variable genes in two samples. MPLC multiple primary lung cancer, IPM intrapulmonary metastasis, ST spatial transcriptomics, IHC immunohistochemistry, TI tumor sample from the inferior lobe, TM tumor tissue from middle lobe, TS tumor tissue from superior lobe, NI normal tissue adjacent to TI, NM normal tissue adjacent to TM, NS normal tissue adjacent to TS, Log2FC log2-transformed fold change. N-within: correlations between normal samples within the same MPLCs patient. T-within: correlations between different tumor lesions within the same MPLCs patient. T-independent: correlations between different tumor tissues from different LUAD patients from GSE131907. corr: Spearman correlation coefficient between the cell type compositions of two samples.

