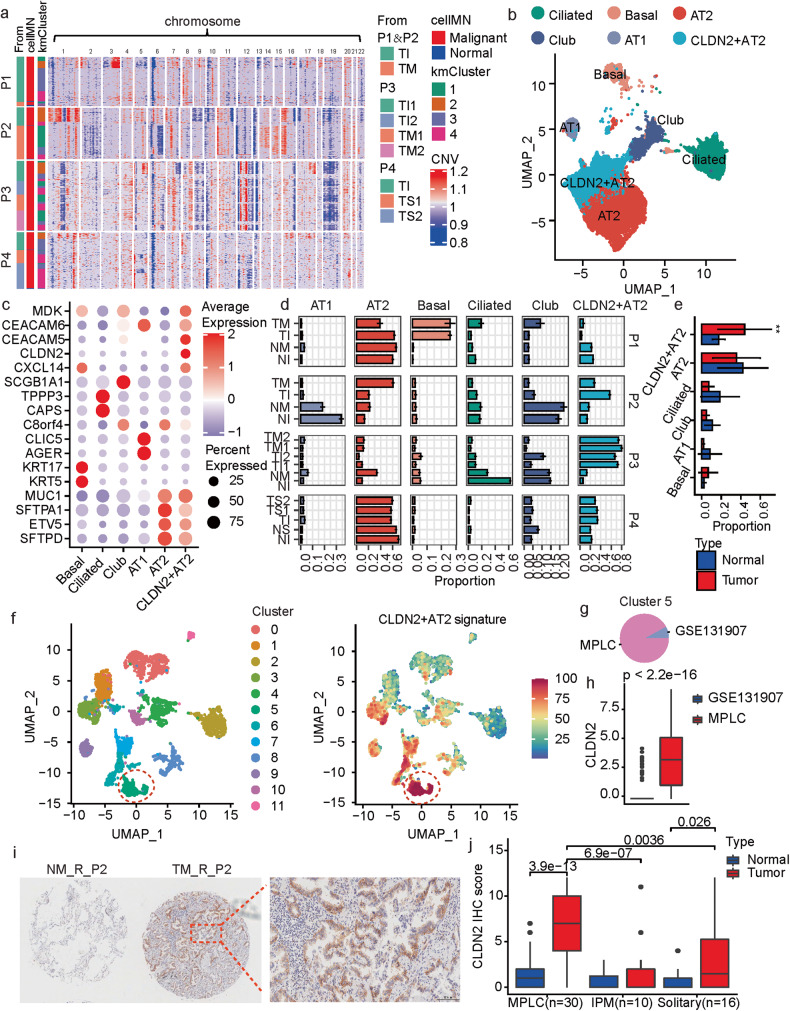
Fig. 2. Subclassification and characterization of epithelial cells in MPLCs.
a Heatmap of CNV profiles estimated from scRNA-seq of tumor lesions from each patient. The vertical axis is arranged by origin patients, samples, cell malignant or not, and on the CNV-based clustering results. The horizontal axis displays all chromosomes in numerical order. kmCluster: the k-means clustering results of epithelial cells based on the CNV profiles. cellMN: whether the cell is malignant or not. b UMAP plot colored by the sub-populations of epithelial cells. c Dot plot of the expression of marker genes for the epithelial cell sub-populations. d Bar plot of the bootstrap proportions of epithelial cell sub-populations within each measured sample. e The epithelial cell sub-population proportions in tumor lesions (red) or the adjacent normal tissues (blue) from the four MPLC patients. Data represent mean ± s.d. **P < 0.01, t test, unpaired. f UMAP view of the clustering results (left) and CLDN2+ AT2 signatures (right) of epithelial cells from both the MPLCs patients and the dataset GSE131907. Batch effects were removed by harmony. The CLDN2+ AT2 signature was calculated based on the cell-wise gene set variation analysis, and the top15 ranked (based on P-values) marker genes for the CLDN2+ AT2 subtype were utilized as the signature gene set. g Pie plot of the data source of cells in Cluster 5 in (f). h Box plot of the differential expressions of CLDN2 between cells from the MPLC patients and GSE131907. Wilcox test, unpaired. i Immunohistochemistry (IHC) of CLDN2 expressions on the MPLCs samples. Samples NM_R_P2 and TM_R_P2 were taken as examples. Red border area was magnified and presented on the right. j Box plot of the differential CLDN2 IHC scores in MPLCs, IPM and solitary LUAD. Each IPM or MPLCs patient possessed two LUAD lesions at ipsilateral different lobes. Wilcox test, unpaired.

