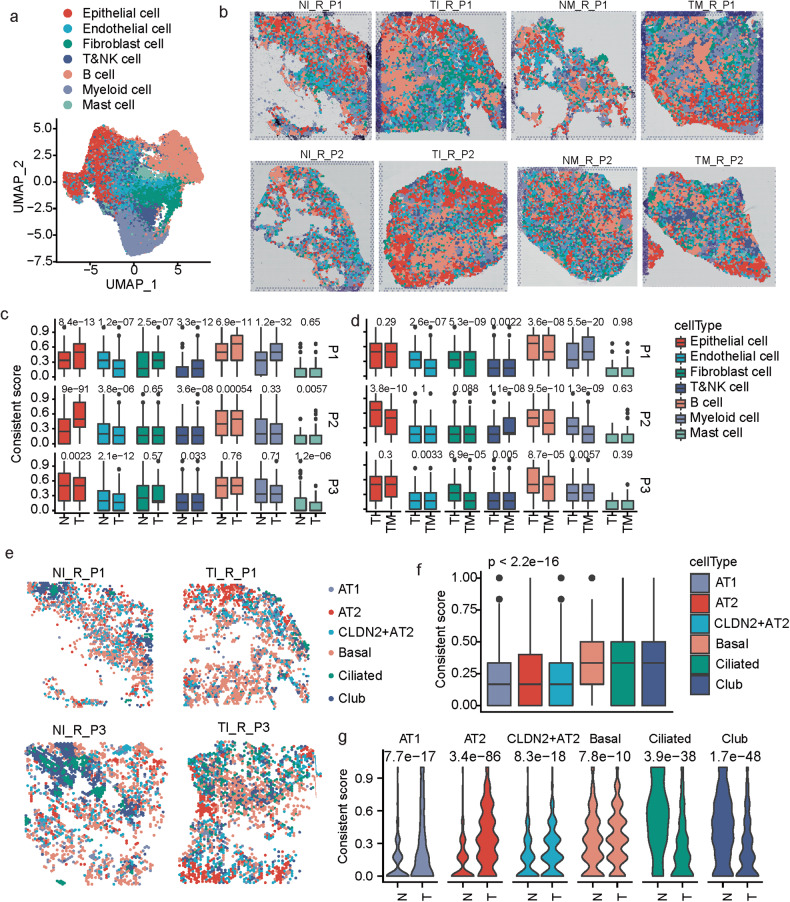
Fig. 5. Spatial features of different cell types in MPLCs.
a UMAP plot of 37616 spatial spots colored by cell types. The cell types of each spot were predicted by integrating the ST-seq data with the scRNA-seq data. b Spatial RNA-seq barcoded spots of the samples from patients P1 and P2, labeled by the predicted cell types. c Box plot of the difference of consistent scores of spots from tumor and normal tissues of the same patient in terms of different dominant cell types. d Box plot of the difference of consistent scores of spots from different tumor lesions of the same patient in terms of different dominant cell types. e Spatial spots colored by the predicted dominant epithelial cell subtypes. Four samples were displayed as examples. f Box plot of the difference of consistent scores of the spatial spots dominated by different epithelial cell subtypes. g Violin plot of the difference of consistent scores of spots from tumor and normal tissues in terms of different dominant epithelial cell subtypes. Kruskal test, unpaired.

