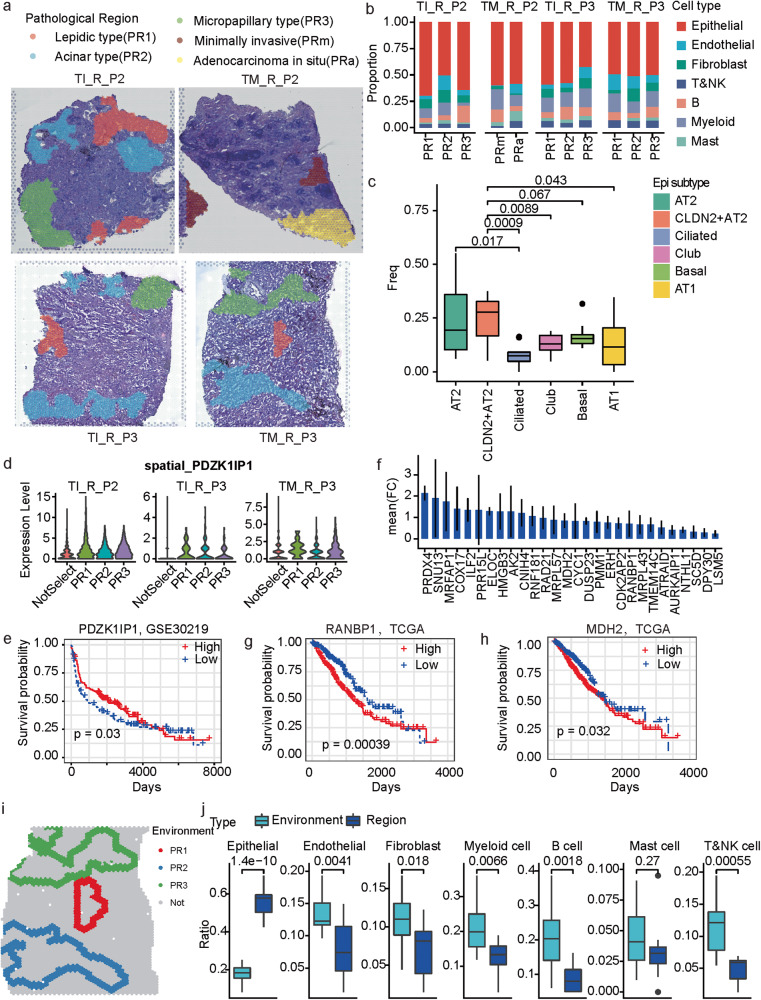
Fig. 6. The cellular and molecular profiles of different histologic patterns in MPLC-LUAD.
a Pathological classification of malignant regions into histologic patterns including lepidic type (PR1), acinar type (PR2), micropapillary type (PR3), minimally invasive (PRm) and adenocarcinoma in situ (PRa). b The main cell type compositions of the pathological regions across the four investigated samples. c Boxplot of the proportions of different epithelial cell sub-populations in the pathological regions across all the investigated samples. t test, unpaired. AT2 and CLDN2+ AT2 are, respectively, compared to the other sub-populations. d Violin plot of the spatially resolved high expression of PDZK1IP1 in the region PR1. e KM-plot of the survival curves of patients in GSE30219. The patients were separated into two groups based on the expression of PDZK1IP1. f Bar plot of the mean fold change of PR3 marker genes shared by the three observed samples. g, h KM-plot of the survival curves of TCGA-LUAD patients. The patients were separated into two groups according to whether the expression of RANBP1 (g) and MDH2 (h) was higher than the median level. i. Spatial neighbors (the nearest three circles of spots) of the malignant regions. Colors represent different malignant regions. Sample TM_R_P3 is displayed as one example. j Box plot of the difference of cell compositions between the malignant regions and corresponding spatial neighbors. t test, unpaired.

