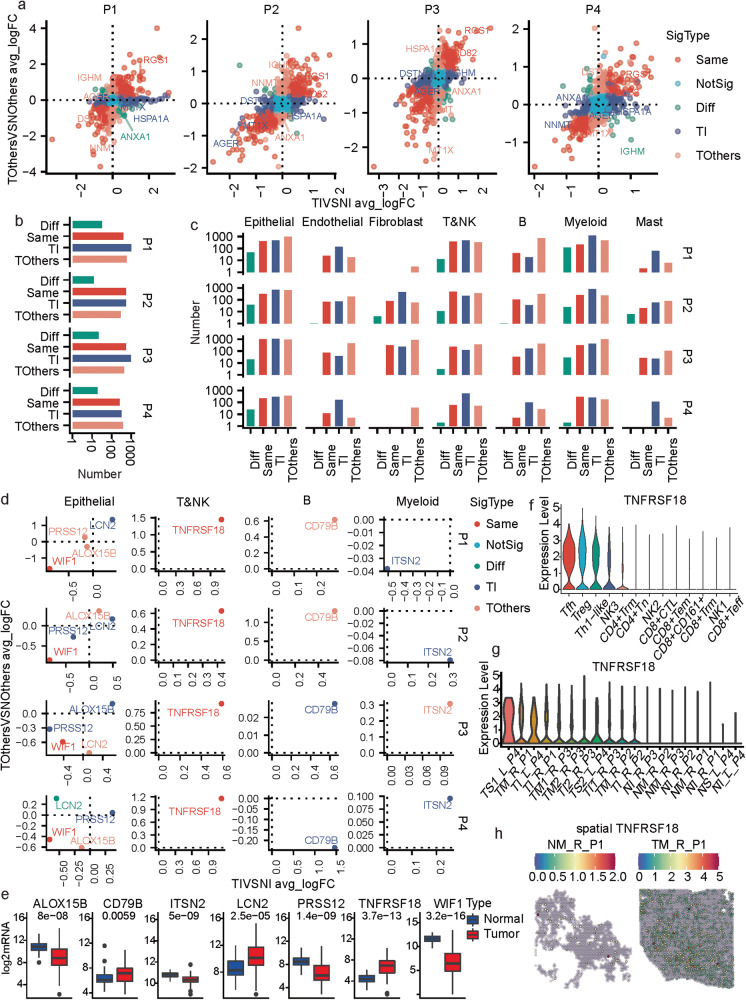
Fig. 7. Molecular and cellular commonness and differences between lesions within the same MPLCs patient.
a Scatter plot of the differential expressions of genes in the two different tumor lesions comparing to the corresponding adjacent normal tissues in each of the four MPLC patients. The x-axis represents the average log2FC (avg_logFC) computed by comparing the tumor and normal tissues in the inferior lobe (TIVSNI) of one patient. The y-axis represents the average log2FC (avg_logFC) computed by comparing the tumor and normal tissues in the other diseased lobe (TOthersVSNOthers) of one patient. The point colors represent the significance type. b Summary of the number of different significant types of genes identified based on each patient. c Summary of the number of different significant types of genes identified based on each cell type and each patient. d Seven Genes showed expressional change in all four MPLCs patients in certain cell types. e Box plot of the seven gene expressions in normal and tumor tissues based on the TCGA-LUAD dataset (p-value: kruskal test). f Violin plot of the expressions of TNFRSF18 across T&NK cell subpopulations. g Violin plot of the expressions of TNFRSF18 across all samples. h Spatially featured plot of the expressions of TNFRSF18 in two samples of P1.

