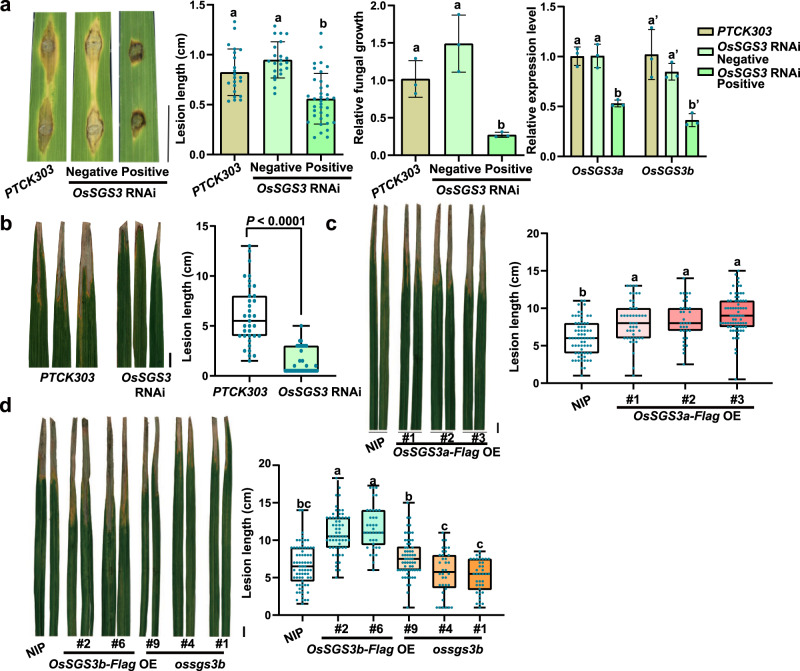
Fig. 5. OsSGS3a negatively regulates rice resistance to Xoo and M. oryzae.
a Blast resistance of positive and negative OsSGS3 RNAi lines at 7 dpi (days post inoculation) with punch injection inoculation (TH12). Left panel: Disease symptom of the indicated lines; Middle panels: lesion length (mean ± s.d.; n = number of biologically independent samples in the graph) were determined, and relative fungal growth (mean ± s.d.; n = 3, biologically independent samples) was determined with fungal POT2 normalized to rice Ubiquitin by qRT-PCR. Right panel: levels of OsSGS3a and OsSGS3b was measured by qRT-PCR. Data are presented as means ± s.d. (n = 3, biologically independent samples). OsActin served as an internal control to normalize the expression of OsSGS3a and OsSGS3b. The expression levels of OsSGS3a and OsSGS3b are decreased in the positive transgenic OsSGS3 RNAi lines, but not in the negative OsSGS3 RNAi lines. The PTCK303 empty vector transgenic plants were used as the control. b–d Bacteria blight resistance of positive OsSGS3 RNAi (b), OsSGS3a-Flag OE (c), OsSGS3b-Flag OE and ossgs3b lines (d). Eight-week-old plant materials grown in field were inoculated with PXO99A (OD600 = 1.0). Disease symptom and lesion lengths were measured at 14 dpi, shown as box plots (n > 34, biologically independent samples). Box plots show the median (central line) and interquartile range (IQR; from the 25th to 75th percentile); whiskers extend to minimum and maximum values within 1.5 times the IQR (b–d). Similar results were obtained from three independent experiments (a–d). Scale bars, 1 cm (a–d). Significant differences were determined by two-tailed Student’s t test (b) or one-way ANOVA with Tukey’s HSD post hoc analysis (a, c, d). Exact P values are indicated above the bars (b) or provided in Supplementary Data 7 (a, c, d). Source data are provided as a Source Data file (a–d).

