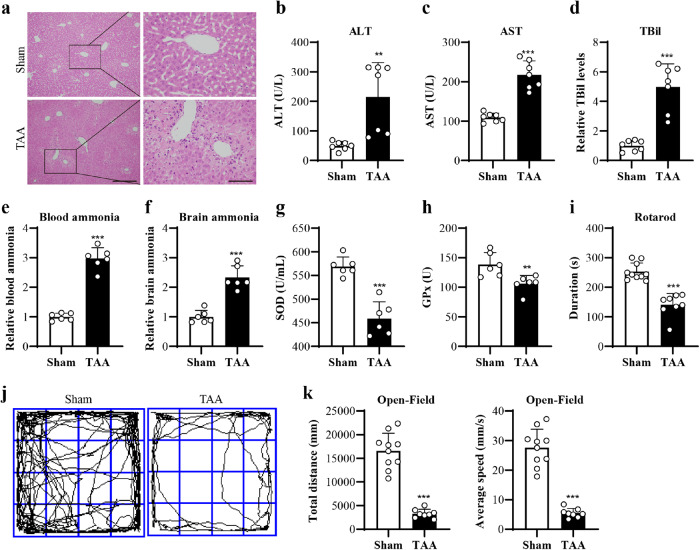
Fig. 1. TAA-treated mice exhibited HE-associated liver and behavioral changes.
a Liver H&E staining (left Bar = 100 µm, right Bar = 30 µm). b–d Elisa results of the serum levels of ALT, AST, and TBil (n = 7 per group). e, f Ammonia levels in blood and brain by Elisa (n = 6 per group). g, h Elisa results of antioxidative biomarkers of SOD and GPx in the blood (n = 6 per group). i Behavioral results of mice by rotarod test (n = 10, 8 per group). j The trajectory of spontaneous activity by open field test. k Analysis of total distance and speed of movement by open field test (n = 10, 8 per group). Data are presented as means ± SD. ** P < 0.01, *** P < 0.001 vs Sham. Two-tailed, unpaired, Student’s t-test for all data. Source data are provided as a Source Data file.

