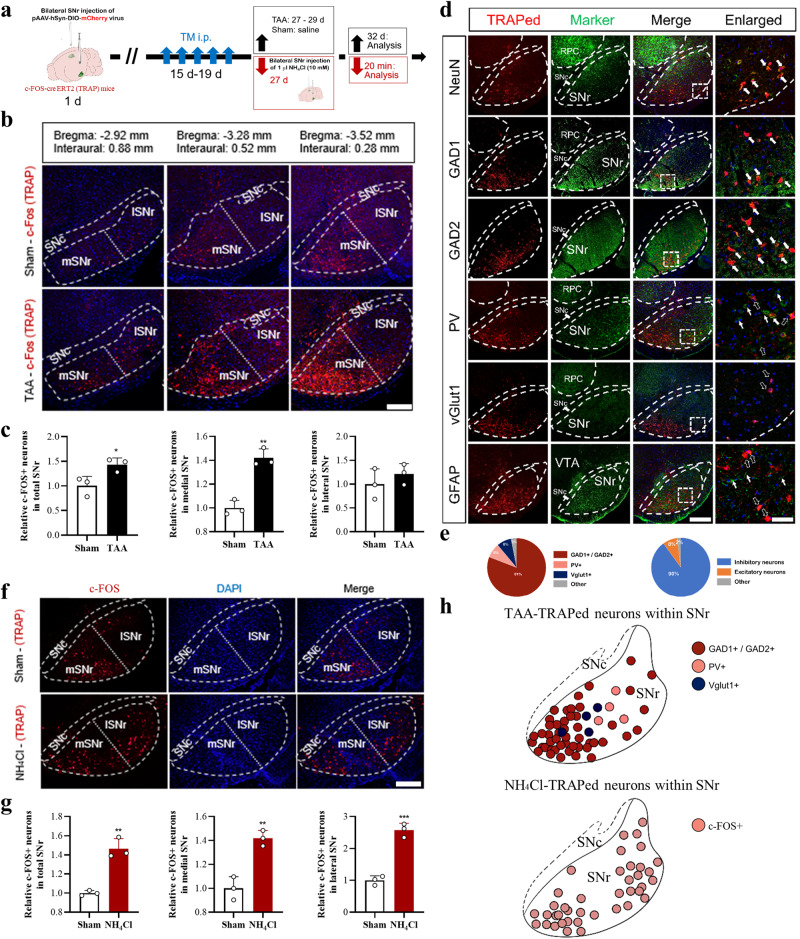
Fig. 5. TAA or direct local high ammonia stimulation activated SNr GABA neurons.
a Schematic flow chart to show the strategy. b Representative confocal images of TAA-TRAPed neurons in different layers of SNr (Bar = 100 μm). c Quantitative analysis of TAA-TRAPed neurons in total (left), medial (middle), and lateral SNr (right) (n = 3 per group, Bar = 100 μm). d Representative confocal images of TAA-TRAPed (red) neurons simultaneously expressing different makers (green) of NeuN, GAD1, GAD2, PV, vGlut1, and GFAP. Blue marked DAPI (Bar = 100 μm or 20 μm). e The charts represent the percentage of GAD1+/ GAD2+, PV+, and vGluT1+ neurons, or the percentage of inhibitory and excitatory neurons. f Representative confocal images of NH4Cl-TRAPed neurons in SNr (Bar = 100 μm). g Quantitative analysis of NH4Cl-TRAPed neurons in total, medial, and lateral SNr (n = 3 per group). h Schematic map of TAA-TRAPed (upper) and NH4Cl-TRAPed (lower) neurons within SNr. In the upper map, red, pink, and dark blue core rings represented GAD1+/GAD2+, PV+, and vGluT1+ neurons, respectively. Data are presented as means ± SD. *P < 0.05, **P < 0.01 vs with Sham. Two-tailed, unpaired, Student’s t-test for all data. The arrows with dashed edges indicated the cells only expressing FOS+, thin solid arrows indicated the cells only expressing green fluorescence, and thick solid arrows indicated the cells expressing both and green fluorescences. SNc substantia nigra pars compacta, SNr substantia nigra pars reticulate, lSNr lateral SNr, mSNr medial SNr. Source data are provided as a Source Data file.

