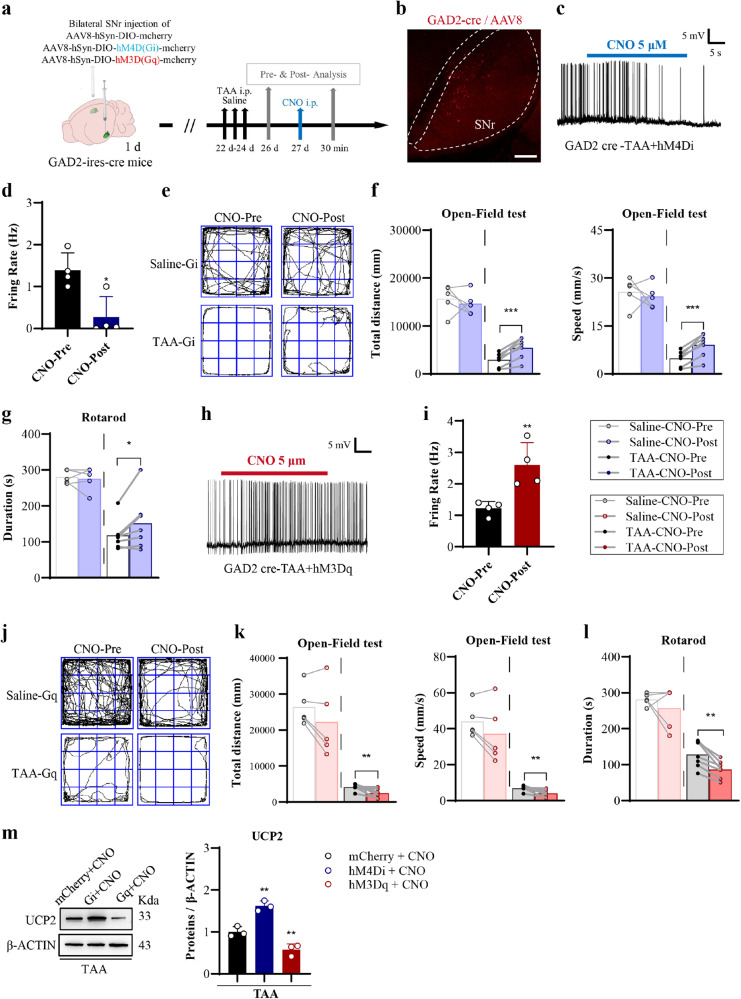
Fig. 6. Causal effects of SNrGAD2 neuron activity on motor behavior in HE.
a Schematic flow chart of Gi or activation Gq of GAD2-expressing GABA population in SNr of GAD2-ires-cre mice. b Representative confocal images of confirmation of AAV8 virus located at SNr (Bar = 100 μm). Regions of interest on 4 sections from a series of section per mouse. Three mice were used. c, d Electrophysiological recording of spontaneous firing frequency (c) and statistical analysis (d) of firing rate (Hz) of GAD2-expressing GABA population in SNr with hM4Di chemogenetic inhibition (n = 4 per group, Bar = 5 mV /5 s). e The trajectories by open field test of the saline-Gi or TAA-Gi mice with pre- and post-CNO injection. f Behavioral results of the total distance and speed by open field test (n = 5, 7 per group). g Behavioral results of duration on the rotarod test (n = 5, 7 per group). h, i Electrophysiological recording of spontaneous firing frequency (h) and analysis (i) of firing rate (Hz) of GAD2-expressing GABA population in SNr with hM3Dq chemogenetic activation (n = 4, Bar = 5 mV/5 s). j The trajectories by open field test of the saline-Gq or TAA-Gq mice with Pre- and Post-CNO injection. k Behavioral results of the total distance and speed by open field test (n = 5, 7 per group). l Behavioral results of duration on the rotarod test (n = 5, 7 per group). m Western blot results and analysis of UCP2 level in SNr of control (mCherry + CNO), chemogenetic inhibition (Gi + CNO), and chemogenetic activation (Gq + CNO) groups (n = 3). Data are presented as means ± SD. *P < 0.05, **P < 0.01, ***P < 0.001 vs with CNO-Pre or mCherry + CNO. Two-tailed, unpaired, Student’s t-test for d, i. Two-tailed, paired, Student’s t-test for f, j, k, l. One-way ANOVA with LSD’s multiple comparison tests for m. Gq hM3Dq, Gi hM4Di. Source data are provided as a Source Data file.

