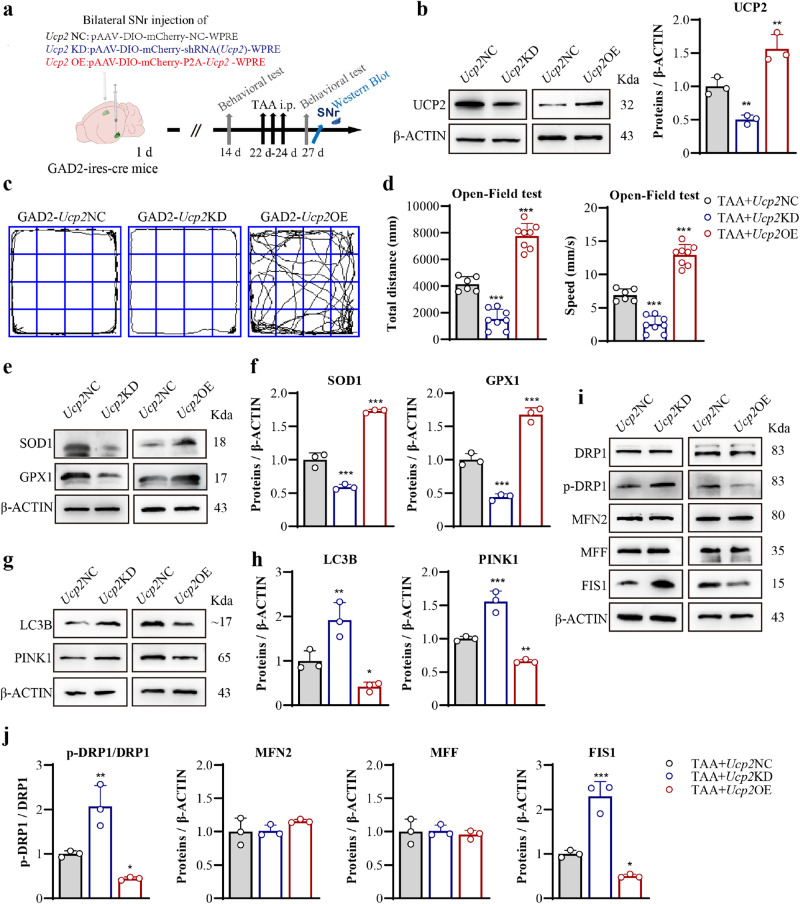
Fig. 7. Effects of UCP2 on the behavior of GAD2 mice and mitochondria of GAD2 neurons in SNr of HE.
a Schematic flow chart of Ucp2 NC, Ucp2 KD and Ucp2 OE of SNrGAD2 expressing GABA population on GAD2-ires-cre mice. b SNr expression of UCP2 from Ucp2 NC, Ucp2 KD and Ucp2 OE assayed by western blot. c The trajectories of Ucp2 NC, Ucp2 KD and Ucp2 OE GAD2-ires-cre mice by open field test (n = 6, 8, 8 per group). d Results of the total distance and speed by open field test (n = 6, 8, 8 per group). e SNr expression of a mitochondrial antioxidative marker of SOD1 and GPX1 from Ucp2 NC, Ucp2 KD and Ucp2 OE, assayed by western blot. f Quantitative analysis of e. g SNr expression of LC3B and PINK1 from Ucp2 NC, Ucp2 KD and Ucp2 OE, assayed by western blot. h Quantitative analysis of g. i SNr expression of DRP1, p-DRP1(Ser616), MFN2, MFF, and FIS1 from Ucp2 NC, Ucp2 KD and Ucp2 OE, assayed by western blot. j Quantitative analysis of i. Data are presented as means ± SD. *P < 0.05, **P < 0.01, ***P < 0.001 vs with TAA + Ucp2 NC. Ucp2 NC samples were collected from the same batch of samples in western blotting (n = 3 per group in all). One-way ANOVA with LSD’s multiple comparison tests for all data. Source data are provided as a Source Data file.

