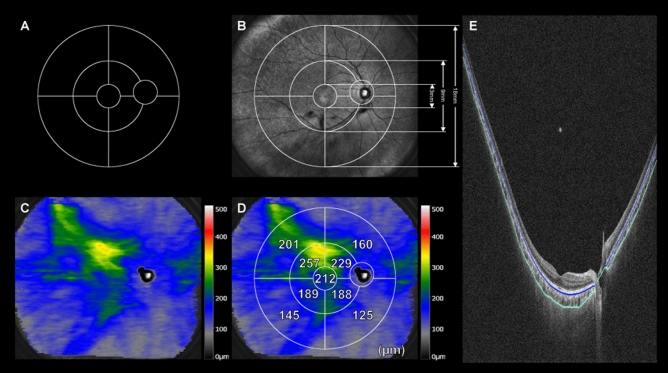
Figure 4.
Thickness map analysis of the healthy choroid using enhanced-depth imaging of widefield swept source optical coherence tomography. (A) The grid for measuring changes in the wide-field choroidal thickness. It comprises nine subfields divided by three circles with diameters of 3, 9, and 18 mm, respectively, and four lines. Circumferential and zonal areas enclosed by these circles are divided into superotemporal, inferotemporal, superonasal, and inferonasal subfields, with consideration of the arrangement of the vortex veins. (B) Infrared scanning laser ophthalmoscopy images overlaid with the measurement grid. (C) A choroidal thickness map. (D) Choroidal thickness values measured using the grid. The value for each subfield represents the mean choroidal thickness (μm) of the subfield. (E) Automatic segmentation of the inner and outer borders of the choroid is performed accurately.

