
Figure 1.
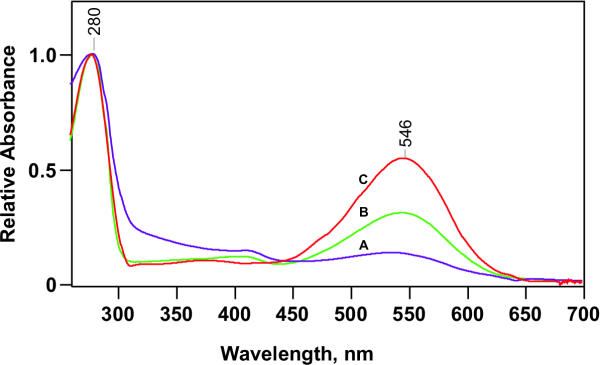
UV/visible absorption spectra of pR in octylglucoside solution (1–3%) at three stages of purification. All three spectra were measured in the presence of octylglucoside at pH 8, and are normalized to the 280-nm protein peak. Spectrum A, the OG extract of cholate-washed E. coli membranes; spectrum B, pooled 546-nm absorbing fractions from Phenylsepharose column; spectrum C, same material after hydroxylapatite column.