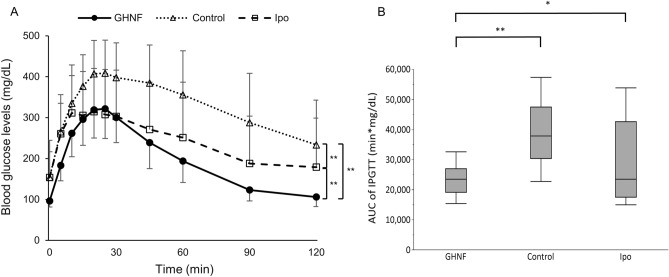
Figure 3.
The glucose tolerance profiles of the GHNF, control and Ipo groups. (A) The results of the intraperitoneal glucose tolerance test (IPGTT) in the GHNF (filled circle, n = 15), control (open triangle, n = 18), and Ipo groups (open square, n = 12) at approximately 42 days after islet transplantation. (B) The area under the curve (AUC) of the IPGTT in each group is shown. The AUC in the GHNF group was significantly lower than that in the control and Ipo groups (*p < 0.05, **p < 0.01).

