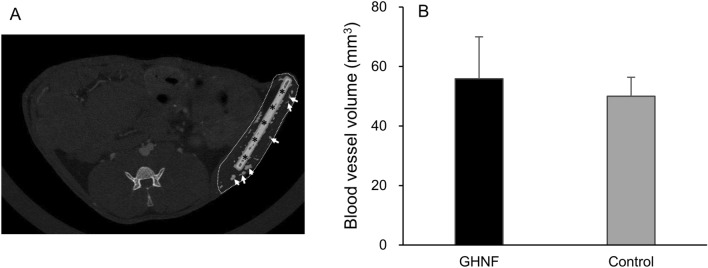
Figure 5.
Quantification of the vascular volume determined through CT analyses in subcutaneous tissues at 6 weeks after pretreatment. (A) A representative CT angiography image. Special care was taken in defining the region of interest (inside dot line) to avoid inclusion of intraperitoneal vascular area. The extracted area around silicon spacer (asterisk) was defined as a vascular area (white arrow). (B) The vascular volume in the GHNF and control groups. The results represent the volume (mm3) and are expressed as the mean ± standard deviation (n = 6).

