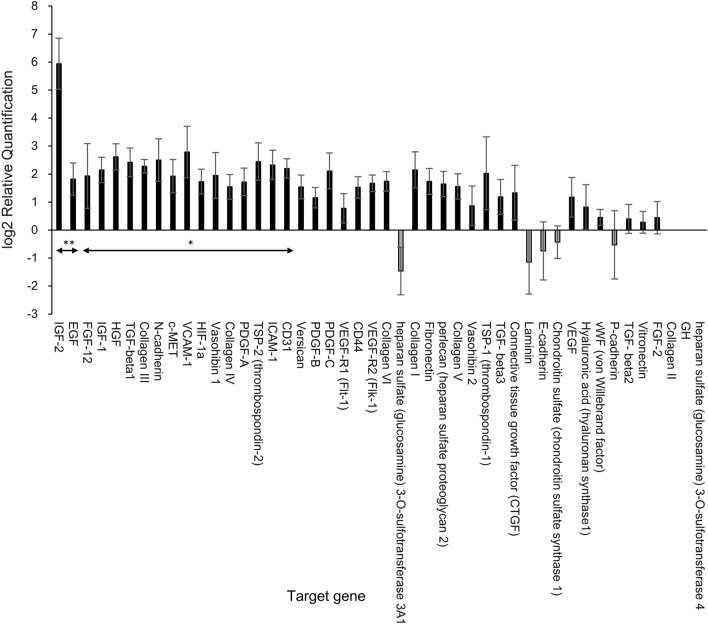
Figure 6.
Upregulated and downregulated genes in the GHNF group (n = 8) in comparison to the control group (n = 8). RNA was extracted from the recipient subcutaneous capsules surrounding the silicon spacer at 42 days after pretreatment. Values represent the mean relative quantification (RQ). Error bars represent the standard error on a log2 RQ-based scale. The + 1 and − 1 values represent a two-fold increase or decrease threshold in the gene expression. The gene expression analyses showed that 19 target genes in the GHNF group were significantly upregulated in comparison to the control group (*p < 0.05, **p < 0.01).

