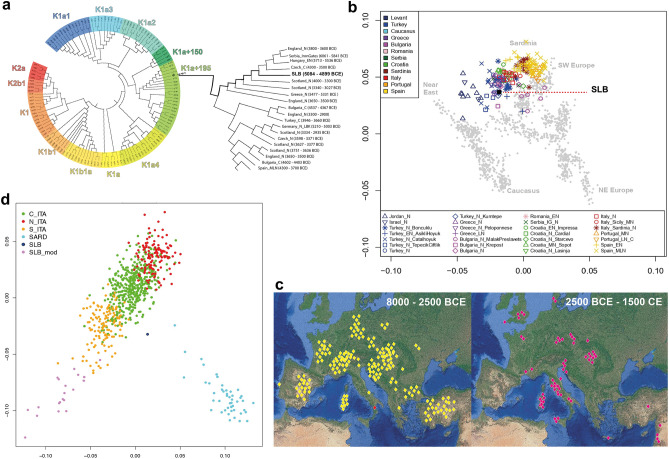
Figure 4.
(a) Phylogenetic reconstruction of ancient K-related mitochondrial lineages shows SLB falling into the variability of K1a + 195 haplogroup (olive green); (b) PCA projection of SLB individual into the variability of ancient Italian and Mediterranean Neolithics; (c) the distribution of G2a-related Y-chromosome lineages in ancient Europe between 8000 and 2500 BCE (left) and 2500 BCE—1500 CE (right). SLB is shown in a red square. Genomic data taken from the David Reich Lab Allen Ancient DNA Resources v54.1. Maps were obtained from the National Geologic Map Database project (https://ngmdb.usgs.gov/topoview/) and adjusted using Adobe Illustrator 2022 v3.0 (available at https://www.adobe.com/products/illustrator/); (d) when projected into the variability of modern Italians, SLB (blue dot) clusters in close proximity to the modern southern Italians (yellow dots) but does not overlap with them.

