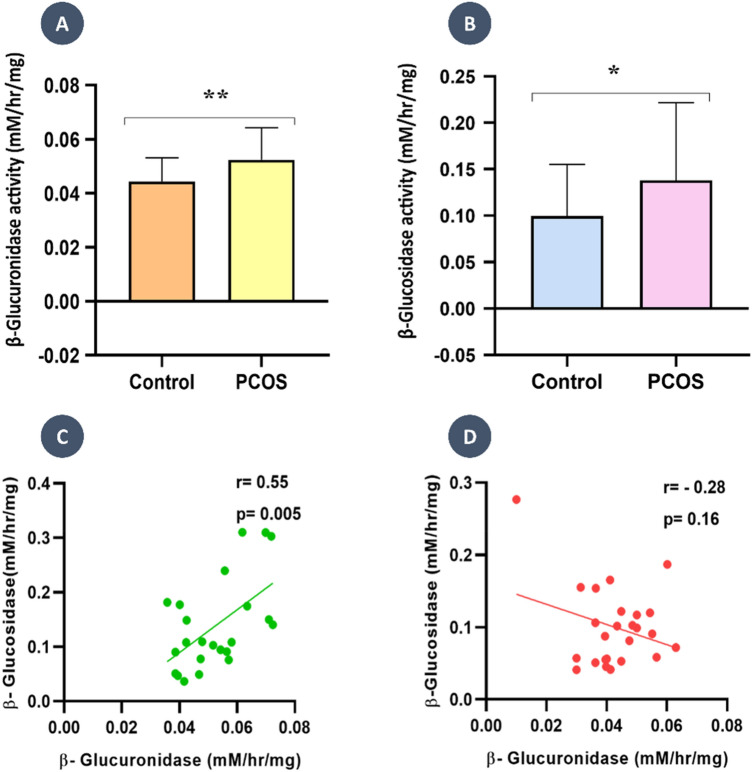
Figure 2.
Average activity of Gut microbial enzymes and correlation analysis. (A) PCOS group present a higher level of gut microbial β-glucuronidase activity compared to Control groups with p < 0.05. (B) Gut microbial β-glucosidase activity shows high in the PCOS group compared to control groups with p > 0.05. (C) PCOS group shows a positive association between β-glucuronidase and β-glucosidase activities with r = 0.55 and p = 0.005. (D) The control group shows a negative association between β-glucuronidase and β-glucosidase activities with r = 0.16 and p = 0.16.

