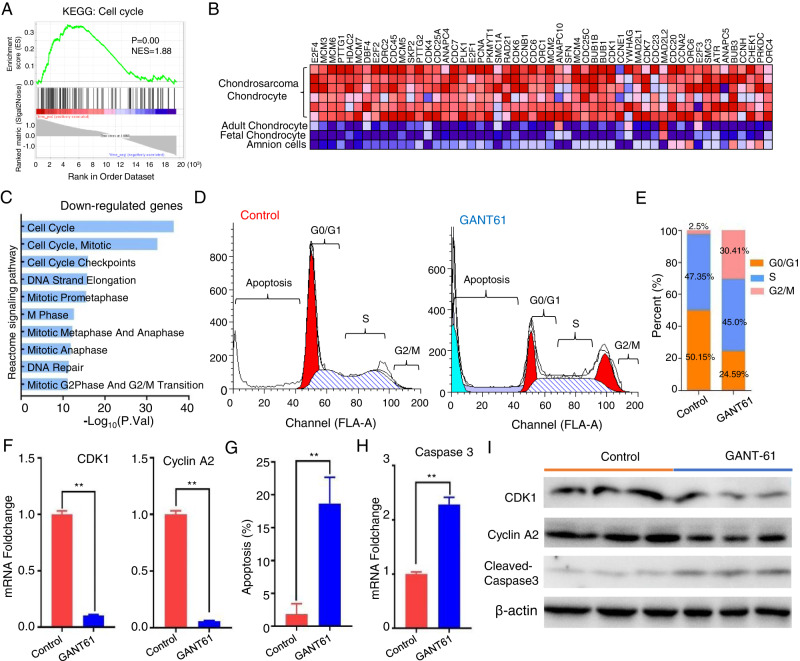
Fig. 4. GANT-61 blocks the chondrosarcoma cells in the G2/M cell cycle phase.
A The GSEA enrichment plot showed cell cycle pathway is enriched in the chondrosarcoma (P < 0.01, NES = 1.88). B The heatmap representation of this subset of genes. C BioPlanet signal pathway enrichment analysis by using the downregulated genes in GANT-61 treatment. D Cell cycle and apoptosis analysis stained by propidium iodide in the isolated tumor cells of the two groups with flow cytometry. E The bar chart shows the percentage of cells in the cell cycle. F qPCR analysis for CDK1 and Cyclin A2 (**P < 0.01). G The bar graph showed a significant increase in apoptosis rate in GANT-61 treatment group (**P < 0.01). H qPCR analysis for Caspase3 (**P < 0.01). I Protein expression levels of CDK1, Cyclin A2, and cleaved-Caspase-3 were assessed using Western blot analysis.

