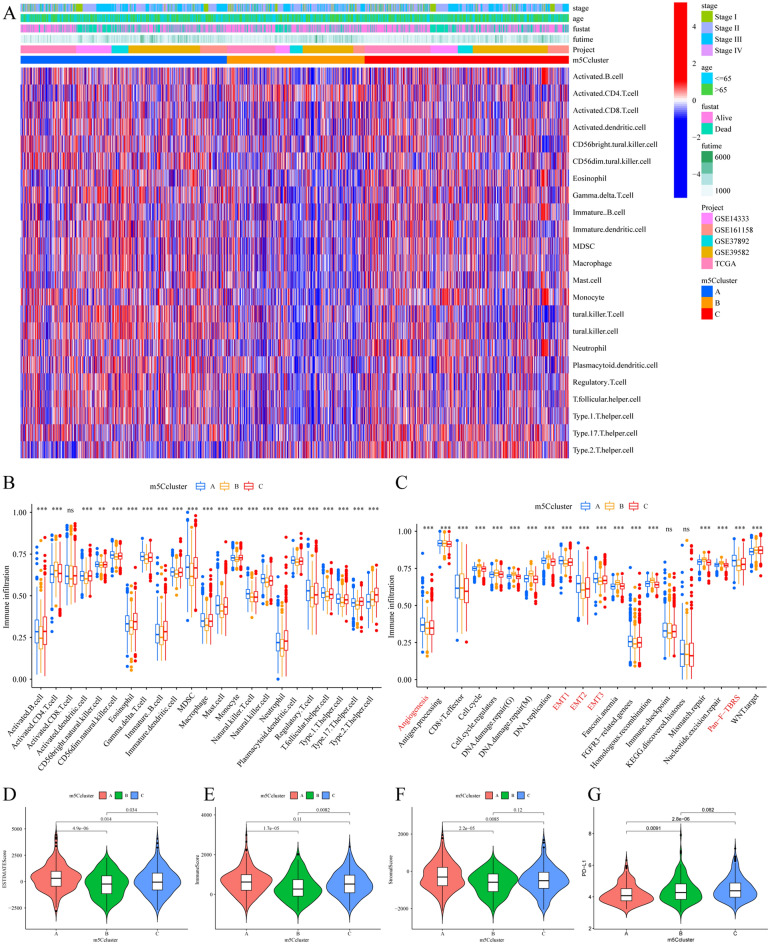
Figure 3.
The distinct TME characteristics between the three m5C modification phenotypes. (A) Heatmap of the different immune cells that infiltrated the TME between the phenotypes. The clinical characteristics and CRC cohort were distributed in distinct m5C clusters. Each column represents patients, and each row represents individual immune cells. (B) The different immune cells infiltrated in the TME of the three m5C clusters calculated by the CIBERSORT algorithm. The Kruskal–Wallis H test was used to statistically analyze the difference between distinct m5C clusters. (C) The difference in the enrichment score of each known biological process gene signature between the three m5C clusters. (D) The immune score, (E) stromal score, and (F) ESTIMATE score of the three gene clusters were analyzed and plotted. (G) The checkpoint gene PD-L1 expression in the distinct m5C clusters.

