Figure 5.
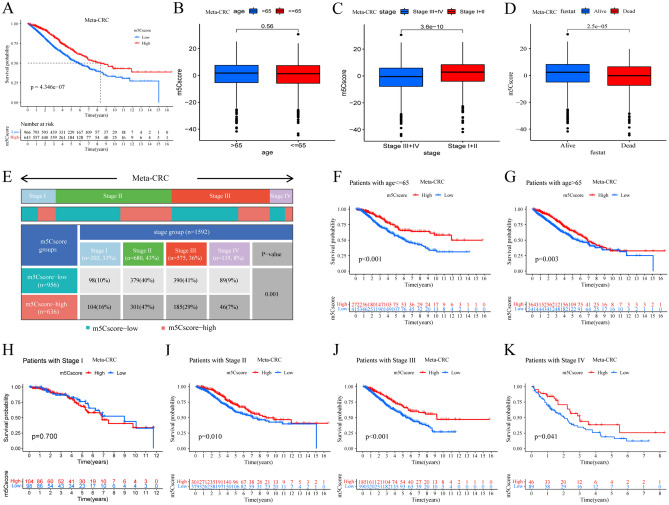
The value of the m5Cscore and clinical function in the meta-CRC cohort. (A) Survival time and survival status comparisons between the high- and low-m5Cscore groups (K-M method, P < 0.001, log-rank test). (B) The difference in the m5Cscore in the distinct CRC age groups (≤ 65 vs. > 65). (C) The difference in the m5Cscore in the distinct CRC stage groups (I + II vs. III + IV). (D) The difference in the m5Cscore in the distinct CRC outcome groups (alive vs. dead). (E) The distribution diagram of the m5Cscore in the distinct CRC stage groups. (F) The OS between the high- and low-m5Cscore groups in the age ≤ 65 group (687 samples) and (G) the age > 65 group (905 samples). (H–K) The OS between the high- and low-m5Cscore groups in I (202 samples), II (680 samples), III (575 samples) and IV (135 samples).

