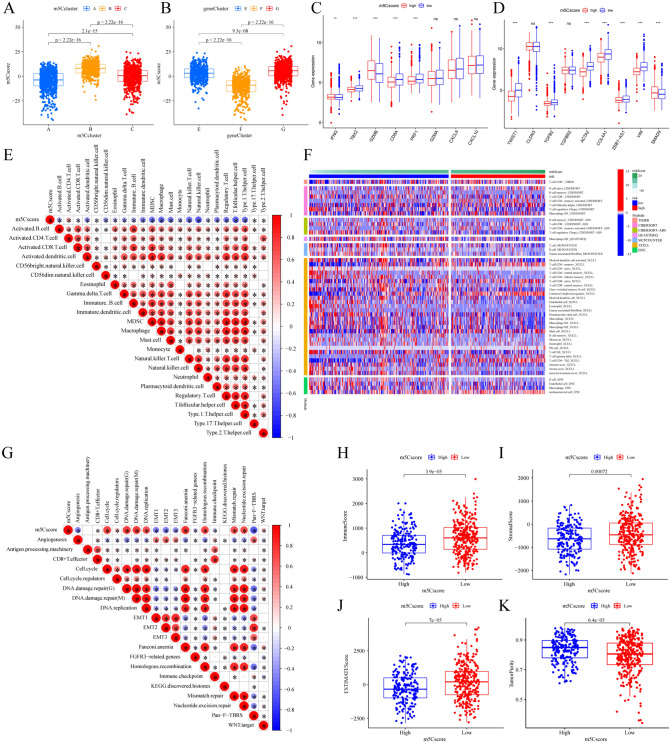
Figure 6.
The TME landscapes and biological processes in the distinct m5Cscore groups. (A) The difference in the m5Cscore in the distinct m5C clusters using the Kruskal–Wallis test. (B) The difference in the m5Cscore in the distinct gene clusters. (C) The differential expression of each gene included in the immune activation-related gene signature between the m5Cscore high and low groups. (D) The differential expression of each gene included in the growth factor TGF-β/EMT pathway gene signature between the high and low m5Cscore groups. (E) The correlation between the m5Cscore and each TME-infiltrating cell type using Spearman analyses. The positive correlation is marked with red, and the negative correlation is marked with blue. The size of the circles represents the correlation coefficient (*P < 0.05). (F) Heatmap of the different immune cells that infiltrated the TME between the high and low m5Cscore groups. The clinical characteristics and CRC cohort distribution in the distinct m5Cscore groups. Each column represents patients, and each row represents individual immune cells. (G) Correlations between the m5Cscore and the known biological gene signatures using Spearman analyses. The positive correlation is marked with red, and the negative correlation is marked with blue. The size of the circles represents the correlation coefficient (*P < 0.05). (H) The different immune scores and three m5C clusters were compared and plotted. (I) Stromal score, (J) ESTIMATE score and (K) tumor purity between the high and low m5Cscore groups.

