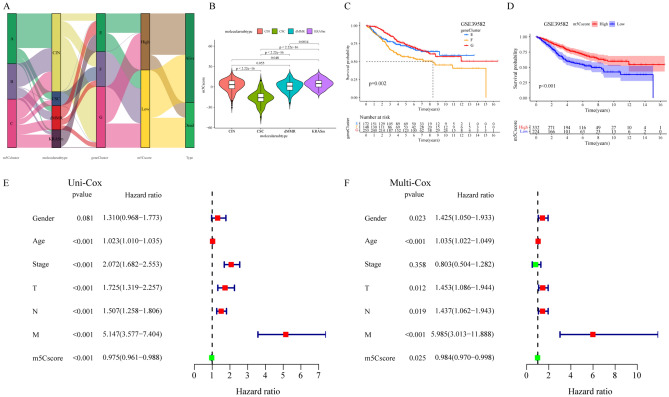
Figure 7.
Characteristics of the m5C modification phenotype and m5Cscore and clinical value in the GSE39582 cohort. (A) Sankey diagram of the m5C clusters distributed to different molecular subtypes (dMMR, CSC, KRASm and CIN), m5C gene cluster, and m5Cscore. (B) The difference in the m5Cscore in the distinct molecular subtype groups (dMMR, CSC, KRASm and CIN). (C) The OS between the distinct m5C-related gene cluster groups. (D) The OS between the distinct high- and low-m5Cscore groups. (E) Univariate Cox regression analyses and (F) multivariate Cox regression analyses to estimate the ability of multiple clinical factors and the m5Cscore to predict OS. The length of the horizontal line represents the 95% confidence interval for each group. The vertical dotted line represents the HR of all patients. The vertical solid line represents HR = 1. The red square and hazard ratio > 1 represent risk factors for survival, and the green square and hazard ratio < 1 represent protective factors for survival.

