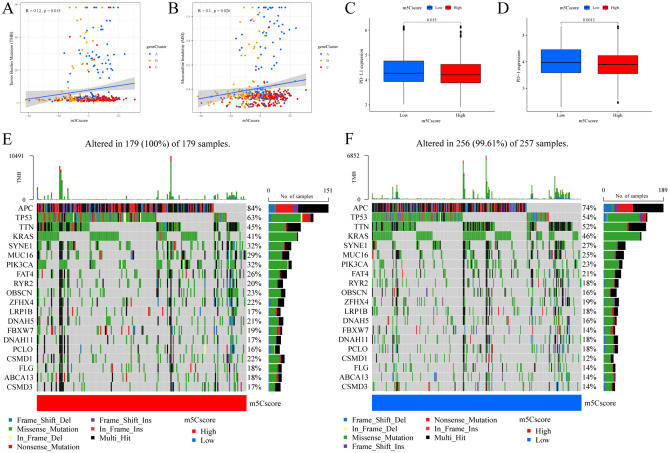
Figure 8.
The role of the m5Cscore in predicting immunotherapeutic benefits. (A) The relationship between the m5Cscore and TMB. (B) The relationship between the m5Cscore and MSI. (C) PD-L1 expression and (D) PD-1 expression between the distinct high and low m5Cscore groups in the meta-CRC cohort. (E,F) Tumor somatic mutations were assessed in individuals in the high and low m5Cscore groups (shown in the left and right waterfall plots, respectively). The individual patients are represented in each column. The upper bar plot is TMB. The mutation frequency in each regulator is shown on the right. The proportion of each variant type is shown on the right bar plot. The fraction of conversions in each patient is shown in the stacked bar plot below.

