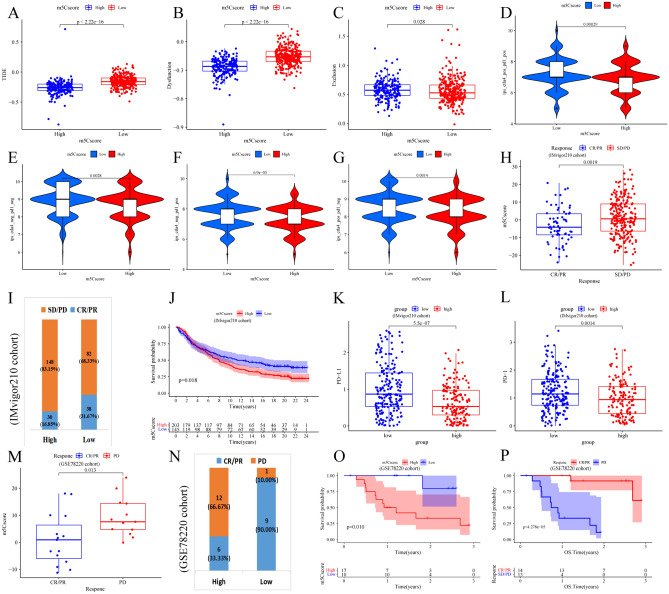
Figure 9.
The predictive effect of the m5Cscore the ICI therapy response. (A–C) The difference in the TIDE scores between the high and low m5Cscore groups. (D–G) The difference in IPS between the high and low m5Cscore groups. (H–L) The prediction effect of anti-PD-L1 immunotherapy of m5Cscore in the IMvigor210 cohort. (H) The distribution of the m5Cscore between the patients with clinical response to anti-PD-L1 immunotherapy (CR, complete response; PR, partial response; SD, stable disease; PD, progressive disease). (I) The fraction of patients who responded to anti-PD-L1 immunotherapy in the high and low m5Cscore groups. (J) The survival analyses for low and high m5Cscore groups (K-M method, log-rank test). (K) PD-L1 expression and (D) PD-1 expression between the distinct high and low m5Cscore groups. (M–P) The prediction effect of the anti-PD-1 immunotherapy of m5Cscore in GSE78220 cohort. (M) The distribution of the m5Cscore between the patients with different clinical responses to anti-PD-1 immunotherapy. (N) The fraction of patients who responded to anti-PD-1 immunotherapy in the high and low m5Cscore groups. (O) The survival analyses for low and high m5Cscore groups (K-M method, log-rank test). (P) The survival analyses for the patients with distinct clinical response to anti-PD-1 immunotherapy groups (K-M method, log-rank test).

