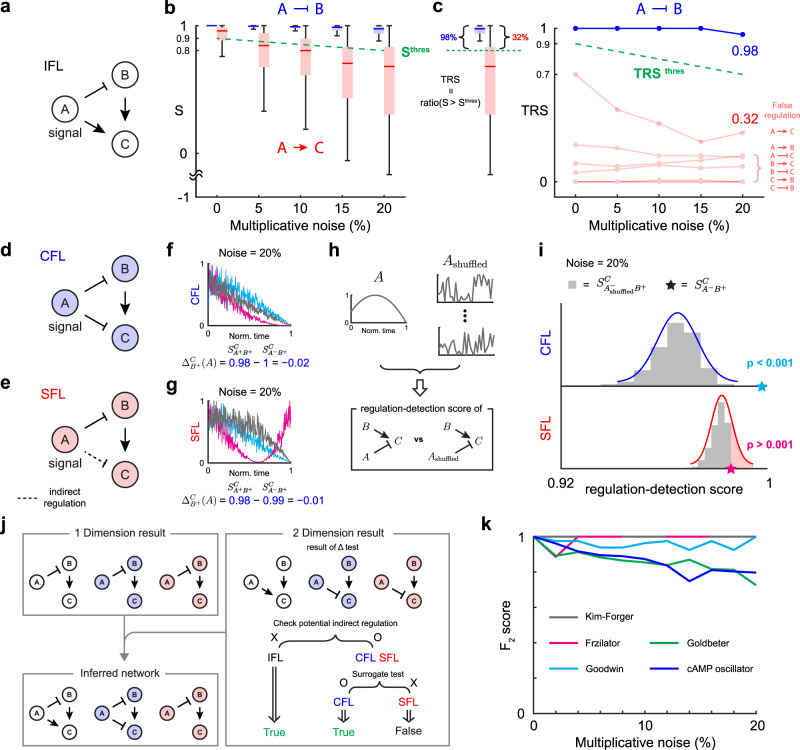
Fig. 3. Extended framework for inferring a regulatory network from noisy data.
a A regulatory network with 1D regulation from A to B and 2D regulation from A and B to C. b The threshold for the regulation-detection score (, green dashed line) distinguishes true (A ⊣ B) and false regulation (A → C). c The fraction of data satisfying , total regulation score (), is used to infer the regulation. Specifically, is used where (green dashed line). Here, data are presented as box plots (n = 100), in which the box bounds the IQR divided by the median, and whiskers extend to a maximum of 1.5 × IQR beyond the box. d In CFL, direct negative regulation from A to C exists. e On the other hand, in SFL, the regulatory chain A ⊣ B → C induces an indirect negative regulation from A to C. f, g cannot distinguish between the direct and indirect regulations in the presence of noise because for both CFL and SFL, indicating the presence of regulation . h, i with the surrogate time series of A can be used to distinguish between the indirect and direct regulations. To disrupt the information of A, the time series of A is shuffled (h). In the presence of direct regulation (CFL), but not indirect regulation (SFL), is significantly smaller than the original (p-value < 0.001). j By including the surrogate test, our extended framework can successfully infer IFL, CFL, and SFL even from noisy time series. k F2 score of our inference method when the level of noise increases from 0 to 20%. Here, the mean of the F2 score for 10 data sets is calculated. Each data set consists of 100 time series, which are simulated with different initial conditions. Source data are provided as a Source Data file.

