
Fig. 2. Mean change from baseline to day 28 in CFS score (pooled results).
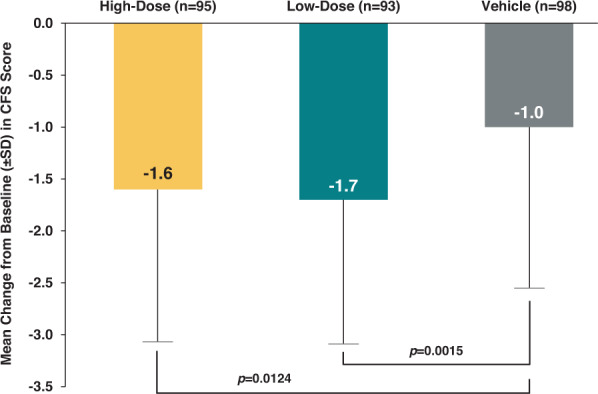
Based on ANCOVA model including baseline CFS score and Study as covariates. Missing data at day 28 has been replaced by the last post-treatment observation available (LOCF method). Low-dose regimen: CsA CE 0.1% BID or 0.05% QID, High-dose regimen: CsA CE 0.1% QID. ANCOVA analysis of covariance, BID twice daily, CFS corneal fluorescein staining, CsA CE cyclosporine A cationic ophthalmic emulsion, LOCF last observation carried forward, QID 4 times daily, SD standard deviation.